
Over the past five years, the semiconductor industry has faced a number of complex challenges. These include increased development costs, eroded ASPs, market saturation and heightened, yet unsustainable M&A activity. As 2018 begins, the semiconductor industry continues to seek a return to stability and organic growth within the parameters of a new business paradigm that is both viable and collaborative. Within this context, semiconductor companies are acknowledging the potential of new markets and downstream revenue opportunities as they explore a more comprehensive “silicon to services” model that spans the data center to the mobile edge. This includes end-to-end IoT security solutions and PaaS-based services such as in-field feature configuration, advanced analytics, predictive maintenance alerts, self-learning algorithms and intelligent, proactive interaction with customers. In addition to services, the concept of open-source hardware and building silicon from disaggregated, pre-verified chiplets is beginning to gain traction as companies move to slash costs and reduce time-to-market for heterogeneous designs. Specific strategies to unlocking the full potential of semiconductors will undoubtedly vary, which is why it is important for us to explore a future in which the industry, along with various research organizations and government offices, plays an open and collaborative role in helping to sustainably monetize both silicon and services.
Search Results for: IoT security
Monetizing Semiconductors: From Silicon to Services

Rambus Reports Fourth Quarter and Fiscal Year 2017 Financial Results
- Annual revenue of $393.1 million, up 17% year over year; fourth quarter revenue of $101.9 million, up 4% year over year
- Fourth quarter GAAP diluted net loss per share of $0.29; fourth quarter non-GAAP diluted net income per share of $0.19
- Annual royalty revenue of $289.6 million and licensing billings of $289.6 million; fourth quarter royalty revenue of $77.9 million and licensing billings of $76.6 million
- CryptoManager IoT Security Service selected by Cybertrust Japan, a subsidiary of Softbank Technology Corp
- Launched GDDR6 PHY to deliver comprehensive solution with Micron, Northwest Logic and Avery Design for AI, Automotive and Networking
SUNNYVALE, Calif. – January 29, 2018 – Rambus Inc. (NASDAQ:RMBS) today reported financial results for the fourth quarter ended December 31, 2017. Total revenue for the quarter was $101.9 million, 4% higher than a year ago, with GAAP diluted net loss per share of $0.29 and non-GAAP diluted net income per share of $0.19. Total revenue for the year ended December 31, 2017 was $393.1 million, 17% higher than a year ago.
“Rambus has transitioned to focus on two key high-growth markets – the data center and the mobile edge – with a product roadmap that leverages our core competencies and key ingredient technologies to both differentiate and accelerate our position in complementary markets,” said Dr. Ron Black, chief executive officer of Rambus. “Our progress throughout 2017, with strong execution on key product programs, positions us well to deliver growth in 2018.”
Business Review
The Rambus Memory and Interface division augmented its suite of IP cores for the data center throughout the year with the announcements of 56G SerDes and High Bandwidth Memory Gen2 (HBM2) PHYs as part of our broad portfolio for data center and networking. In addition, the team announced the GDDR6 Memory PHY for Artificial Intelligence (AI), automotive and networking, with a comprehensive solution to be offered in conjunction with Micron, Northwest Logic and Avery Designs. Our chip product offering grew with the launch of the DDR4 non-volatile DIMM (NVDIMM) buffer chip and the industry’s first functional silicon of a server DIMM buffer chipset capable of achieving the speeds expected for next-generation DDR5.
Our Security division, which consists of our cryptography, mobile payments and smart ticketing businesses, extended its product and service portfolio with the launch of our Host Card Emulation (HCE) Ticket Wallet Service and white-label mobile application, the Unified Payment Platform, bringing bank-level security to retail “scan-and-go”, and the CryptoManager IoT Security Service, protecting and monitoring IoT endpoints. We continue to gain commercial traction across our products and services with committed transport pilots and retail deployments, as well as Cybertrust Japan, a subsidiary of Softbank Technology Corp, selecting the CryptoManager IoT Security Service protect their Secure IoT Platform®.
| Financial Review | GAAP | Non-GAAP(1) | |||||||||||||
| (In millions, except for percentages and per share amounts) | Three Months Ended December 31, | Three Months Ended December 31, | |||||||||||||
| 2017 | 2016 | 2017 | 2016 | ||||||||||||
| Revenue | $ | 101.9 | $ | 97.6 | $ | 101.9 | $ | 97.6 | |||||||
| Total operating costs and expenses | $ | 86.2 | $ | 97.1 | $ | 68.4 | $ | 67.5 | |||||||
| Operating income | $ | 15.7 | $ | 0.5 | $ | 33.5 | $ | 30.1 | |||||||
| Operating margin | 15% | 1% | 33% | 31% | |||||||||||
| Net income (loss) | $ | (31.8) | $ | (3.4) | $ | 21.2 | $ | 18.7 | |||||||
| Diluted net income (loss) per share | $ | (0.29) | $ | (0.03) | $ | 0.19 | $ | 0.16 | |||||||
| Total cash and marketable securities | $ | 329.4 | $ | 172.2 | $ | 329.4 | $ | 172.2 | |||||||
| Total assets | $ | 884.6 | $ | 783.5 | $ | 884.6 | $ | 783.5 | |||||||
| Total stockholders’ equity | $ | 564.9 | $ | 552.8 | $ | 564.9 | $ | 552.8 | |||||||
| Cashflows from operations | $ | 59.8 | $ | 33.3 | $ | 59.8 | $ | 33.3 | |||||||
| Financial Review | GAAP | Non-GAAP(1) | |||||||||||||
| (In millions, except for percentages and per share amounts) | Year Ended December 31, | Year Ended December 31, | |||||||||||||
| 2017 | 2016 | 2017 | 2016 | ||||||||||||
| Revenue | $ | 393.1 | $ | 336.6 | $ | 393.1 | $ | 336.6 | |||||||
| Total operating costs and expenses | $ | 338.7 | $ | 303.0 | $ | 269.1 | $ | 227.8 | |||||||
| Operating income | $ | 54.4 | $ | 33.6 | $ | 124.0 | $ | 108.8 | |||||||
| Operating margin | 14% | 10% | 32% | 32% | |||||||||||
| Net income (loss) | $ | (18.5) | $ | 6.8 | $ | 77.5 | $ | 67.9 | |||||||
| Diluted net income (loss) per share | $ | (0.17) | $ | 0.06 | $ | 0.68 | $ | 0.60 | |||||||
| Cashflows from operations | $ | 117.4 | $ | 92.5 | $ | 117.4 | $ | 92.5 | |||||||
(1) See “Supplemental Reconciliation of GAAP to Non-GAAP Results” and “Reconciliation of Other GAAP to Non-GAAP Items” tables included below. Note that the applicable non-GAAP measures are presented and that revenue, the balance sheet items and cashflows from operations are solely presented on a GAAP basis.
| 2017 Revenue and Licensing Billings | |||||||||||||||||||
| (In thousands) | Quarter ended | Year ended | |||||||||||||||||
| December 31,
2017 |
September 30,
2017 |
June 30,
2017 |
March 31,
2017 |
December 31,
2017 |
|||||||||||||||
| Revenue | |||||||||||||||||||
| Royalties | $ | 77,861 | $ | 72,787 | $ | 69,990 | $ | 68,956 | $ | 289,594 | |||||||||
| Product revenue | 8,543 | 8,661 | 8,401 | 10,904 | 36,509 | ||||||||||||||
| Contract and other revenue | 15,487 | 17,686 | 16,329 | 17,491 | 66,993 | ||||||||||||||
| Total revenue | $ | 101,891 | $ | 99,134 | $ | 94,720 | $ | 97,351 | $ | 393,096 | |||||||||
| Licensing billings (1) | $ | 76,611 | $ | 71,537 | $ | 72,890 | $ | 68,556 | $ | 289,594 | |||||||||
| 2016 Revenue and Licensing Billings | |||||||||||||||||||
| (In thousands) | Quarter ended | Year ended | |||||||||||||||||
| December 31,
2016 |
September 30,
2016 |
June 30,
2016 |
March 31,
2016 |
December 31,
2016 |
|||||||||||||||
| Revenue | |||||||||||||||||||
| Royalties | $ | 70,604 | $ | 68,298 | $ | 62,835 | $ | 62,877 | $ | 264,614 | |||||||||
| Product revenue | 11,746 | 7,092 | 3,902 | 3,312 | 26,052 | ||||||||||||||
| Contract and other revenue | 15,209 | 14,465 | 9,764 | 6,493 | 45,931 | ||||||||||||||
| Total revenue | $ | 97,559 | $ | 89,855 | $ | 76,501 | $ | 72,682 | $ | 336,597 | |||||||||
| Licensing billings (1) | $ | 64,854 | $ | 71,548 | $ | 66,604 | $ | 61,683 | $ | 264,689 | |||||||||
(1) Licensing billings is an operational metric that reflects amounts invoiced to our patent and technology licensing customers during the period.
Revenue for the quarter was $101.9 million due to continued strength in our licensing program. As a result of our execution in both businesses, revenue for our Memory and Interface Division was up 8% year over year and revenue for our Security Division was up 3% year over year. We had GAAP operating income of $54.4 million for the year, an increase of 62% year over year. In the fourth quarter, we had GAAP net loss per share of $0.29, related primarily to a revaluation of our deferred tax assets in conjunction with U.S. tax legislation passed in December 2017. In the fourth quarter, we had non-GAAP net income per share of $0.19, at the mid-point of our expectations.
Cash, cash equivalents, and marketable securities as of December 31, 2017 were $329.4 million, an increase of $145.7 million from September 30, 2017, mainly due to the issuance of $172.5 million aggregate principal amount of the 2023 convertible notes during the quarter and cash generated from operating activities of approximately $59.8 million, offset by the $56.8 million paid to extinguish a portion of our existing 2018 convertible notes. Adjusted EBITDA for the quarter was $36.8 million.
2018 First Quarter Outlook
Effective January 1, 2018, the Company adopted Accounting Standards Update No. 2014-09, Revenue from Contracts with Customers in Accounting Standards Codification Topic 606 (“ASC 606”), which supersedes the revenue recognition requirements in ASC Topic 605, Revenue Recognition (“ASC 605”). The Company expects the adoption of ASC 606 to materially impact the timing of revenue recognition for its fixed-fee intellectual property licensing arrangements. The Company does not expect the adoption of ASC 606 to have a material impact on its other revenue streams, cashflow from operations, or the underlying financial position of the Company.
The Company has provided its first quarter outlook under both ASC 606 and ASC 605 in order to provide additional transparency. The Company believes that providing this additional disclosure in the short term will help our investors and analysts understand the impact of the change in revenue recognition standards, especially given the material difference expected in the timing of revenue recognition for our fixed-fee licensing arrangements as mentioned above. Note that the presentation under ASC 605 is not a substitute for the new ASC 606 revenue recognition standard under GAAP applicable for the first quarter of 2018.
Additionally, the guidance below under ASC 606 and ASC 605 excludes results from our lighting division. Given that the lighting division has been roughly breakeven for the Company, this exclusion does not impact the Company’s outlook on profitability, though it does reduce revenue outlook by roughly $4.0 million for the first quarter of 2018.
| 2018 First Quarter Outlook under ASC 606 | |||
| (In millions, except per share amounts) | GAAP | Non-GAAP (1) | |
| Revenue | $41 – $47 | $41 – $47 | |
| Total operating costs and expenses | $86 – $82 | $67 – $63 | |
| Operating loss | $45 – $35 | $26 – $16 | |
| Diluted net loss per share | $0.34 – $0.27 | $0.19 – $0.12 |
(1) See “Reconciliation of GAAP Forward Looking Estimates to Non-GAAP Forward Looking Estimates” tables included below. Note that the applicable non-GAAP measures are presented and that revenue is solely presented on a GAAP basis.
For the first quarter of 2018, the Company expects revenue under ASC 606 to be between $41 million and $47 million. The Company expects royalty revenue to be between $21 million and $27 million, and roughly $20 million from product, contract and other revenue. Revenue is not without risk and achieving revenue in this range will require that the Company sign customer agreements for patent licensing, various product sales, mobile payments software and solutions licensing among other matters.
The Company also expects operating costs and expenses to be between $86 million and $82 million, and diluted net loss per share to be between $0.34 and $0.27. Additionally, the Company expects non-GAAP operating costs and expenses to be between $67 million and $63 million, and non-GAAP diluted net loss per share to be between $0.19 and $0.12. These expectations also assume non-GAAP interest and other income and expense of $2 million, tax rate of 24% (refer to non-GAAP financial information below – income tax adjustments) and diluted share count of 110 million, and exclude stock-based compensation expense ($8 million), amortization expense ($11 million), and non-cash interest expense on convertible notes ($3 million).
| 2018 First Quarter Outlook under ASC 605 | |||
| (In millions, except per share amounts) | GAAP | Non-GAAP (1) | |
| Revenue | $94 – $100 | $94 – $100 | |
| Total operating costs and expenses | $86 – $82 | $67 – $63 | |
| Operating income | $9 – $19 | $27 – $37 | |
| Diluted net income per share | $0.03 – $0.09 | $0.17 – $0.23 |
(1) See “Reconciliation of GAAP Forward Looking Estimates to Non-GAAP Forward Looking Estimates” tables included below. Note that the applicable non-GAAP measures are presented and that revenue is solely presented on a GAAP basis.
For the first quarter of 2018, the Company expects revenue under ASC 605 to be between $94 million and $100 million. The Company expects royalty revenue to be between $74 million and $80 million, and roughly $20 million from product, contract and other revenue. Revenue is not without risk and achieving revenue in this range will require that the Company sign customer agreements for patent licensing, various product sales, mobile payments software and solutions licensing among other matters.
The Company also expects operating costs and expenses to be between $86 million and $82 million, and diluted net income per share to be between $0.03 and $0.09. Additionally, the Company expects non-GAAP operating costs and expenses to be between $67 million and $63 million, and non-GAAP diluted net income per share to be between $0.17 and $0.23. These expectations also assume non-GAAP interest and other income and expense of $2 million, tax rate of 24% (refer to non-GAAP financial information below – income tax adjustments) and diluted share count of 114 million, and exclude stock-based compensation expense ($8 million), amortization expense ($11 million), and non-cash interest expense on convertible notes ($3 million).
Conference Call:
The Company will host a conference call at 2:00 p.m. PT today to discuss its financial results. The call, audio and slides will be available online at investor.rambus.com. A replay will be available following the call as a webcast on the Rambus Investor Relations website and for one week at the following numbers: (855) 859-2056 (domestic) or (404) 537-3406 (international) with ID#8596527.
Non-GAAP Financial Information:
In the commentary set forth above and in the financial statements included in this earnings release, the Company presents the following non-GAAP financial measures: operating costs and expenses, operating margin, operating income (loss), net income (loss), diluted net income (loss) per share and Adjusted EBITDA. In computing each of these non-GAAP financial measures, the following items were considered as discussed below: stock-based compensation expenses, acquisition-related transaction costs and retention bonus expense, amortization expenses, loss on extinguishment of debt, non-cash interest expense and certain other one-time adjustments. The non-GAAP financial measures disclosed by the Company should not be considered a substitute for, or superior to, financial measures calculated in accordance with GAAP, and the financial results calculated in accordance with GAAP and reconciliations from these results should be carefully evaluated. Management believes the non-GAAP financial measures are appropriate for both its own assessment of, and to show investors, how the Company’s performance compares to other periods. The non-GAAP financial measures used by the Company may be calculated differently from, and therefore may not be comparable to, similarly titled measures used by other companies. Reconciliation from GAAP to non-GAAP results is included in the financial statements contained in this release.
The Company’s non-GAAP financial measures reflect adjustments based on the following items:
Stock-based compensation expense. These expenses primarily relate to employee stock options, employee stock purchase plans, and employee non-vested equity stock and non-vested stock units. The Company excludes stock-based compensation expense from its non-GAAP measures primarily because such expenses are non-cash expenses that the Company does not believe are reflective of ongoing operating results. Additionally, given the fact that other companies may grant different amounts and types of equity awards and may use different option valuation assumptions, excluding stock-based compensation expense permits more accurate comparisons of the Company’s results with peer companies.
Acquisition-related transaction costs and retention bonus expense. These expenses include all direct costs of certain acquisitions and the current periods’ portion of any retention bonus expense associated with the acquisitions. The Company excludes these expenses in order to provide better comparability between periods.
Purchase accounting adjustment for inventory fair value step-up. These adjustments are the result of accounting for certain business acquisitions and are excluded because such adjustments are non-recurring. Additionally, the Company excludes these expenses in order to provide better comparability between periods.
Amortization expense. The Company incurs expenses for the amortization of intangible assets acquired in acquisitions. The Company excludes these items because these expenses are not reflective of ongoing operating results in the period incurred. These amounts arise from the Company’s prior acquisitions and have no direct correlation to the operation of the Company’s core business.
Impairment of long-lived assets. These charges consist of non-cash charges to long-lived assets and are excluded because such charges are non-recurring and do not reduce the Company’s liquidity.
Change in contingent consideration. This change is due to a reduction of acquisition purchase consideration. This is a non-recurring benefit that has no direct correlation to the operation of the Company’s business and no cash flow impact.
Loss on extinguishment of debt. The Company has excluded loss on extinguishment of debt as this represents a cost of refinancing its existing convertible notes and is not a reflection of the Company’s ongoing operations.
Non-cash interest expense on convertible notes. The Company incurs non-cash interest expense related to its convertible notes. The Company excludes non-cash interest expense related to its convertible notes to provide more accurate comparisons of the Company’s results with other peer companies and to more accurately reflect the Company’s ongoing operations.
Income tax adjustments. For purposes of internal forecasting, planning and analyzing future periods that assume net income from operations, the Company estimates a fixed, long-term projected tax rate of approximately 35 percent for both 2017 and 2016, and 24 percent for 2018 which consists of estimated U.S. federal and state tax rates, and excludes tax rates associated with certain items such as withholding tax, tax credits, deferred tax asset valuation allowance and the release of any deferred tax asset valuation allowance. Accordingly, the Company has applied these tax rates to its non-GAAP financial results for all periods in the relevant years to assist the Company’s planning. The Company has provided below a reconciliation of its GAAP provision for income taxes and GAAP effective tax rate to the assumed non-GAAP provision for income taxes and non-GAAP effective tax rate.
On occasion in the future, there may be other items, such as significant gains or losses from contingencies that the Company may exclude in deriving its non-GAAP financial measures if it believes that doing so is consistent with the goal of providing useful information to investors and management.
Forward-Looking Statements
This release contains forward-looking statements under the Private Securities Litigation Reform Act of 1995 including those relating to Rambus’ expectations regarding our new product and service offerings, growth for 2018 and financial guidance for the first quarter of 2018, including revenue, operating costs and expenses, earnings per share and estimated, fixed, long-term projected tax rates, both on a GAAP and non-GAAP basis as appropriate. Such forward-looking statements are based on current expectations, estimates and projections, management’s beliefs and certain assumptions made by Rambus’ management. Actual results may differ materially. Rambus’ business generally is subject to a number of risks which are described more fully in Rambus’ periodic reports filed with the Securities and Exchange Commission. Rambus undertakes no obligation to update forward-looking statements to reflect events or circumstances after the date hereof.
Rambus Inc.
Condensed Consolidated Balance Sheets
(In thousands)
(Unaudited)
|
|
December 31,
2017 |
December 31,
2016 |
|||||
| ASSETS | |||||||
| Current assets: | |||||||
| Cash and cash equivalents | $ | 225,844 | $ | 135,294 | |||
| Marketable securities | 103,532 | 36,888 | |||||
| Accounts receivable | 25,892 | 21,099 | |||||
| Prepaids and other current assets | 11,317 | 17,867 | |||||
| Inventories | 5,159 | 5,633 | |||||
| Total current assets | 371,744 | 216,781 | |||||
| Intangible assets, net | 91,722 | 132,388 | |||||
| Goodwill | 209,661 | 204,794 | |||||
| Property, plant and equipment, net | 54,303 | 58,442 | |||||
| Deferred tax assets | 152,651 | 168,342 | |||||
| Other assets | 4,543 | 2,749 | |||||
| Total assets | $ | 884,624 | $ | 783,496 | |||
| LIABILITIES & STOCKHOLDERS’ EQUITY | |||||||
| Current liabilities: | |||||||
| Accounts payable | $ | 9,614 | $ | 9,793 | |||
| Accrued salaries and benefits | 17,091 | 14,177 | |||||
| Deferred revenue | 18,272 | 16,932 | |||||
| Convertible notes, short-term | 78,451 | — | |||||
| Other accrued liabilities | 9,414 | 10,399 | |||||
| Total current liabilities | 132,842 | 51,301 | |||||
| Long-term liabilities: | |||||||
| Convertible notes, long-term | 135,447 | 126,167 | |||||
| Long-term imputed financing obligation | 37,262 | 38,029 | |||||
| Other long-term liabilities | 14,188 | 15,217 | |||||
| Total long-term liabilities | 186,897 | 179,413 | |||||
| Total stockholders’ equity | 564,885 | 552,782 | |||||
| Total liabilities and stockholders’ equity | $ | 884,624 | $ | 783,496 | |||
Rambus Inc.
Condensed Consolidated Statements of Operations
(In thousands, except per share amounts)
(Unaudited)
|
|
Three Months Ended December 31, |
Year Ended December 31, |
|||||||||||||
| 2017 | 2016 | 2017 | 2016 | ||||||||||||
| Revenue: | |||||||||||||||
| Royalties | $ | 77,861 | $ | 70,604 | $ | 289,594 | $ | 264,614 | |||||||
| Product revenue | 8,543 | 11,746 | 36,509 | 26,052 | |||||||||||
| Contract and other revenue | 15,487 | 15,209 | 66,993 | 45,931 | |||||||||||
| Total revenue | 101,891 | 97,559 | 393,096 | 336,597 | |||||||||||
| Operating costs and expenses: | |||||||||||||||
| Cost of product revenue (1) | 5,901 | 8,748 | 23,783 | 21,329 | |||||||||||
| Cost of contract and other product revenue | 12,090 | 12,622 | 55,364 | 45,761 | |||||||||||
| Research and development (1) | 39,417 | 38,744 | 149,135 | 129,844 | |||||||||||
| Sales, general and administrative (1) | 28,818 | 25,466 | 110,940 | 95,145 | |||||||||||
| Impairment of long-lived assets | — | 18,300 | — | 18,300 | |||||||||||
| Change in contingent consideration | — | (6,845) | — | (6,845) | |||||||||||
| Gain from sale of intellectual property | (54) | — | (533) | — | |||||||||||
| Gain from settlement | — | — | — | (579) | |||||||||||
| Total operating costs and expenses | 86,172 | 97,035 | 338,689 | 302,955 | |||||||||||
| Operating income | 15,719 | 524 | 54,407 | 33,642 | |||||||||||
| Interest income and other income (expense), net | 893 | 218 | 1,384 | 1,740 | |||||||||||
| Loss on extinguishment of debt | (1,082) | — | (1,082) | — | |||||||||||
| Interest expense | (3,966) | (3,248) | (13,720) | (12,745) | |||||||||||
| Interest and other income (expense), net | (4,155) | (3,030) | (13,418) | (11,005) | |||||||||||
| Income (loss) before income taxes | 11,564 | (2,506) | 40,989 | 22,637 | |||||||||||
| Provision for income taxes | 43,331 | 939 | 59,450 | 15,817 | |||||||||||
| Net income (loss) | $ | (31,767) | $ | (3,445) | $ | (18,461) | $ | 6,820 | |||||||
| Net income (loss) per share: | |||||||||||||||
| Basic | $ | (0.29) | $ | (0.03) | $ | (0.17) | $ | 0.06 | |||||||
| Diluted | $ | (0.29) | $ | (0.03) | $ | (0.17) | $ | 0.06 | |||||||
| Weighted average shares used in per share calculation | |||||||||||||||
| Basic | 109,737 | 110,788 | 110,198 | 110,162 | |||||||||||
| Diluted | 109,737 | 110,788 | 110,198 | 113,140 | |||||||||||
_________
(1) Total stock-based compensation expense for the three months and years ended December 31, 2017 and 2016 are presented as follows:
|
Three Months Ended December 31, |
Year Ended December 31, |
||||||||||||||
| 2017 | 2016 | 2017 | 2016 | ||||||||||||
| Cost of product revenue | $ | 25 | $ | 14 | $ | 78 | $ | 56 | |||||||
| Research and development | $ | 3,137 | $ | 2,639 | $ | 12,185 | $ | 9,165 | |||||||
| Sales, general and administrative | $ | 4,072 | $ | 3,004 | $ | 15,140 | $ | 11,792 | |||||||
Rambus Inc.
Supplemental Reconciliation of GAAP to Non-GAAP Results
(In thousands)
(Unaudited)
| Three Months Ended | Year Ended | ||||||||||||||||||
| December 31,
2017 |
September 30,
2017 |
December 31,
2016 |
December 31,
2017 |
December 31,
2016 |
|||||||||||||||
| Operating costs and expenses | $ | 86,172 | $ | 82,124 | $ | 97,035 | $ | 338,689 | $ | 302,955 | |||||||||
| Adjustments: | |||||||||||||||||||
| Stock-based compensation expense | (7,234) | (6,964) | (5,657) | (27,403) | (21,013) | ||||||||||||||
| Acquisition-related transaction costs and retention bonus expense | (30) | (47) | (197) | (248) | (3,235) | ||||||||||||||
| Purchase accounting adjustment for inventory fair value step-up | — | — | (1,136) | — | (2,304) | ||||||||||||||
| Amortization expense | (10,526) | (10,498) | (11,093) | (41,962) | (37,138) | ||||||||||||||
| Impairment of long-lived assets | — | — | (18,300) | — | (18,300) | ||||||||||||||
| Change in contingent consideration | — | — | 6,845 | — | 6,845 | ||||||||||||||
| Non-GAAP operating costs and expenses | $ | 68,382 | $ | 64,615 | $ | 67,497 | $ | 269,076 | $ | 227,810 | |||||||||
| Operating income | $ | 15,719 | $ | 17,010 | $ | 524 | $ | 54,407 | $ | 33,642 | |||||||||
| Adjustments: | |||||||||||||||||||
| Stock-based compensation expense | 7,234 | 6,964 | 5,657 | 27,403 | 21,013 | ||||||||||||||
| Acquisition-related transaction costs and retention bonus expense | 30 | 47 | 197 | 248 | 3,235 | ||||||||||||||
| Purchase accounting adjustment for inventory fair value step-up | — | — | 1,136 | — | 2,304 | ||||||||||||||
| Amortization expense | 10,526 | 10,498 | 11,093 | 41,962 | 37,138 | ||||||||||||||
| Impairment of long-lived assets | — | — | 18,300 | — | 18,300 | ||||||||||||||
| Change in contingent consideration | — | — | (6,845) | — | (6,845) | ||||||||||||||
| Non-GAAP operating income | $ | 33,509 | $ | 34,519 | $ | 30,062 | $ | 124,020 | $ | 108,787 | |||||||||
| Income (loss) before income taxes | $ | 11,564 | $ | 13,931 | $ | (2,506) | $ | 40,989 | $ | 22,637 | |||||||||
| Adjustments: | |||||||||||||||||||
| Stock-based compensation expense | 7,234 | 6,964 | 5,657 | 27,403 | 21,013 | ||||||||||||||
| Acquisition-related transaction costs and retention bonus expense | 30 | 47 | 197 | 248 | 3,235 | ||||||||||||||
| Purchase accounting adjustment for inventory fair value step-up | — | — | 1,136 | — | 2,304 | ||||||||||||||
| Amortization expense | 10,526 | 10,498 | 11,093 | 41,962 | 37,138 | ||||||||||||||
| Impairment of long-lived assets | — | — | 18,300 | — | 18,300 | ||||||||||||||
| Change in contingent consideration | — | — | (6,845) | — | (6,845) | ||||||||||||||
| Loss on extinguishment of debt | 1,082 | — | — | 1,082 | — | ||||||||||||||
| Non-cash interest expense on convertible notes | 2,255 | 1,801 | 1,723 | 7,579 | 6,749 | ||||||||||||||
| Non-GAAP income before income taxes | $ | 32,691 | $ | 33,241 | $ | 28,755 | $ | 119,263 | $ | 104,531 | |||||||||
| GAAP provision for income taxes | 43,331 | 6,236 | 939 | 59,450 | 15,817 | ||||||||||||||
| Adjustment to GAAP provision for income taxes | (31,889) | 5,398 | 9,125 | (17,708) | 20,769 | ||||||||||||||
| Non-GAAP provision for income taxes | 11,442 | 11,634 | 10,064 | 41,742 | 36,586 | ||||||||||||||
| Non-GAAP net income | $ | 21,249 | $ | 21,607 | $ | 18,691 | $ | 77,521 | $ | 67,945 | |||||||||
| Non-GAAP basic net income per share | $ | 0.19 | $ | 0.20 | $ | 0.17 | $ | 0.70 | $ | 0.62 | |||||||||
| Non-GAAP diluted net income per share | $ | 0.19 | $ | 0.19 | $ | 0.16 | $ | 0.68 | $ | 0.60 | |||||||||
| Weighted average shares used in non-GAAP per share calculation: | |||||||||||||||||||
| Basic | 109,737 | 109,555 | 110,788 | 110,198 | 110,162 | ||||||||||||||
| Diluted | 114,341 | 113,119 | 114,060 | 113,899 | 113,140 | ||||||||||||||
Supplemental Reconciliation of GAAP to Non-GAAP Effective Tax Rate (1)
| Three Months Ended | Year Ended | |||||||||||||
| December 31,
2017 |
September 30,
2017 |
December 31,
2016 |
December 31,
2017 |
December 31,
2016 |
||||||||||
| GAAP effective tax rate | 375% | 45% | (38)% | 145% | 70% | |||||||||
| Adjustment to GAAP effective tax rate | (340)% | (10)% | 73% | (110)% | (35)% | |||||||||
| Non-GAAP effective tax rate | 35% | 35% | 35% | 35% | 35% | |||||||||
- For purposes of internal forecasting, planning and analyzing future periods that assume net income from operations, the Company estimates a fixed, long-term projected tax rate of approximately 35 percent for both 2017 and 2016, which consists of estimated U.S. federal and state tax rates, and excludes tax rates associated with certain items such as withholding tax, tax credits, deferred tax asset valuation allowance and the release of any deferred tax asset valuation allowance. Accordingly, the Company has applied these tax rates to its non-GAAP financial results for all periods in the relevant year to assist the Company’s planning.
Rambus Inc.
Reconciliation of Other GAAP to Non-GAAP Items
(In thousands, except percentages)
(Unaudited)
| GAAP | Non-GAAP | ||||||||||||||
| Three Months Ended
December 31, |
Three Months Ended
December 31, |
||||||||||||||
| 2017 | 2016 | 2017 | 2016 | ||||||||||||
| Revenue (i) | $ | 101,891 | $ | 97,559 | $ | 101,891 | $ | 97,559 | |||||||
| Operating income (ii) | 15,719 | 524 | 33,509 | 30,062 | |||||||||||
| Operating margin (ii/i) | 15% | 1% | 33% | 31% | |||||||||||
| GAAP | Non-GAAP | ||||||||||||||
| Year Ended
December 31, |
Year Ended December 31, |
||||||||||||||
| 2017 | 2016 | 2017 | 2016 | ||||||||||||
| Revenue (i) | $ | 393,096 | $ | 336,597 | $ | 393,096 | $ | 336,597 | |||||||
| Operating income (ii) | 54,407 | 33,642 | 124,020 | 108,787 | |||||||||||
| Operating margin (ii/i) | 14% | 10% | 32% | 32% | |||||||||||
| Three Months Ended
December 31, |
|||||||
| 2017 | 2016 | ||||||
| Net loss | $ | (31,767) | $ | (3,445) | |||
| Add back: | |||||||
| Interest and other income (expense), net | 4,155 | 3,030 | |||||
| Provision for income taxes | 43,331 | 939 | |||||
| Depreciation expense | 3,304 | 3,577 | |||||
| Amortization expense | 10,526 | 11,093 | |||||
| EBITDA (1) | $ | 29,549 | $ | 15,194 | |||
| Adjustments: | |||||||
| Stock-based compensation expense | 7,234 | 5,657 | |||||
| Acquisition-related transaction costs and retention bonus expense | 30 | 197 | |||||
| Purchase accounting adjustment for inventory fair value step-up | — | 1,136 | |||||
| Impairment of long-lived assets | — | 18,300 | |||||
| Change in contingent consideration | — | (6,845) | |||||
| Adjusted EBITDA (2) | $ | 36,813 | $ | 33,639 | |||
(1) EBITDA is a non-GAAP measure that management uses to evaluate the cash generating capacity of the company. The most directly comparable GAAP measure is net income (loss). EBITDA is net income (loss) adjusted for net interest and other income (expense), income taxes, and depreciation and amortization. It should not be considered as an alternative to net income computed under GAAP.
(2) Adjusted EBITDA excludes the impact of other non-GAAP adjustments indicated in the above tables.
Rambus Inc.
Reconciliation of GAAP Forward Looking Estimates to Non-GAAP Forward Looking Estimates
(In millions, except per share amounts)
(Unaudited)
| 2018 First Quarter Outlook under ASC 606 | Three Months Ended
March 31, 2018 |
||||||
| Low | High | ||||||
| Forward-looking operating costs and expenses | $ | 85.5 | $ | 81.5 | |||
| Adjustments: | |||||||
| Stock-based compensation expense | (7.5) | (7.5) | |||||
| Amortization expense | (11.0) | (11.0) | |||||
| Forward-looking Non-GAAP operating costs and expenses | $ | 67.0 | $ | 63.0 | |||
| Forward-looking operating loss | $ | (44.5) | $ | (34.5) | |||
| Adjustments: | |||||||
| Stock-based compensation expense | 7.5 | 7.5 | |||||
| Amortization expense | 11.0 | 11.0 | |||||
| Forward-looking Non-GAAP operating loss | $ | (26.0) | $ | (16.0) | |||
| Forward-looking loss before income taxes | $ | (48.9) | $ | (38.9) | |||
| Adjustments: | |||||||
| Stock-based compensation expense | 7.5 | 7.5 | |||||
| Amortization expense | 11.0 | 11.0 | |||||
| Non-cash interest expense on convertible notes | 2.7 | 2.7 | |||||
| Forward-looking Non-GAAP loss before income taxes | $ | (27.7) | $ | (17.7) | |||
| Forward-looking GAAP benefit from income taxes | (11.7) | (9.3) | |||||
| Adjustment to forward-looking GAAP benefit from income taxes | 5.1 | 5.1 | |||||
| Forward-looking Non-GAAP benefit from income taxes | (6.6) | (4.2) | |||||
| Forward-looking Non-GAAP net loss | $ | (21.1) | $ | (13.5) | |||
| Forward-looking Non-GAAP basic net loss per share | $ | (0.19) | $ | (0.12) | |||
| Forward-looking Non-GAAP diluted net loss per share | $ | (0.19) | $ | (0.12) | |||
| Weighted average shares used in forward-looking Non-GAAP per share calculation: | |||||||
| Basic | 110.0 | 110.0 | |||||
| Diluted | 110.0 | 110.0 | |||||
| 2018 First Quarter Outlook under ASC 605 (1) | Three Months Ended
March 31, 2018 |
||||||
| Low | High | ||||||
| Forward-looking operating costs and expenses | $ | 85.5 | $ | 81.5 | |||
| Adjustments: | |||||||
| Stock-based compensation expense | (7.5) | (7.5) | |||||
| Amortization expense | (11.0) | (11.0) | |||||
| Forward-looking Non-GAAP operating costs and expenses | $ | 67.0 | $ | 63.0 | |||
| Forward-looking operating income | $ | 8.5 | $ | 18.5 | |||
| Adjustments: | |||||||
| Stock-based compensation expense | 7.5 | 7.5 | |||||
| Amortization expense | 11.0 | 11.0 | |||||
| Forward-looking Non-GAAP operating income | $ | 27.0 | $ | 37.0 | |||
| Forward-looking income before income taxes | $ | 4.1 | $ | 14.1 | |||
| Adjustments: | |||||||
| Stock-based compensation expense | 7.5 | 7.5 | |||||
| Amortization expense | 11.0 | 11.0 | |||||
| Non-cash interest expense on convertible notes | 2.7 | 2.7 | |||||
| Forward-looking Non-GAAP income before income taxes | $ | 25.3 | $ | 35.3 | |||
| Forward-looking GAAP provision for income taxes | 1.0 | 3.4 | |||||
| Adjustment to forward-looking GAAP provision for income taxes | 5.1 | 5.1 | |||||
| Forward-looking Non-GAAP provision for income taxes | 6.1 | 8.5 | |||||
| Forward-looking Non-GAAP net income | $ | 19.2 | $ | 26.8 | |||
| Forward-looking Non-GAAP basic net income per share | $ | 0.17 | $ | 0.24 | |||
| Forward-looking Non-GAAP diluted net income per share | $ | 0.17 | $ | 0.23 | |||
| Weighted average shares used in forward-looking Non-GAAP per share calculation: | |||||||
| Basic | 110.0 | 110.0 | |||||
| Diluted | 114.4 | 114.4 | |||||
(1) See “2018 First Quarter Outlook” above for an explanation of the presentation of this ASC 605 outlook.
Rambus at CES 2018: Running with Cybertrust’s Hamon
Rambus and Cybertrust Corporation, a security services company based in Tokyo, will introduce a new user experience through the Rambus “CryptoManager™ IoT Security Service” and Cybertrust’s “Secure IoT Platform®” (SIOTP) for a wearable IoT total service “hamon®” provided by Mitsufuji Corporation. The hamon will be exhibited at Mitsufuji’s booth (Halls A-D, Booth 45637) during CES (Consumer Electronics Show) 2018, the world’s largest consumer electronics fair held in Las Vegas, USA from January 9th to 12th, 2018.
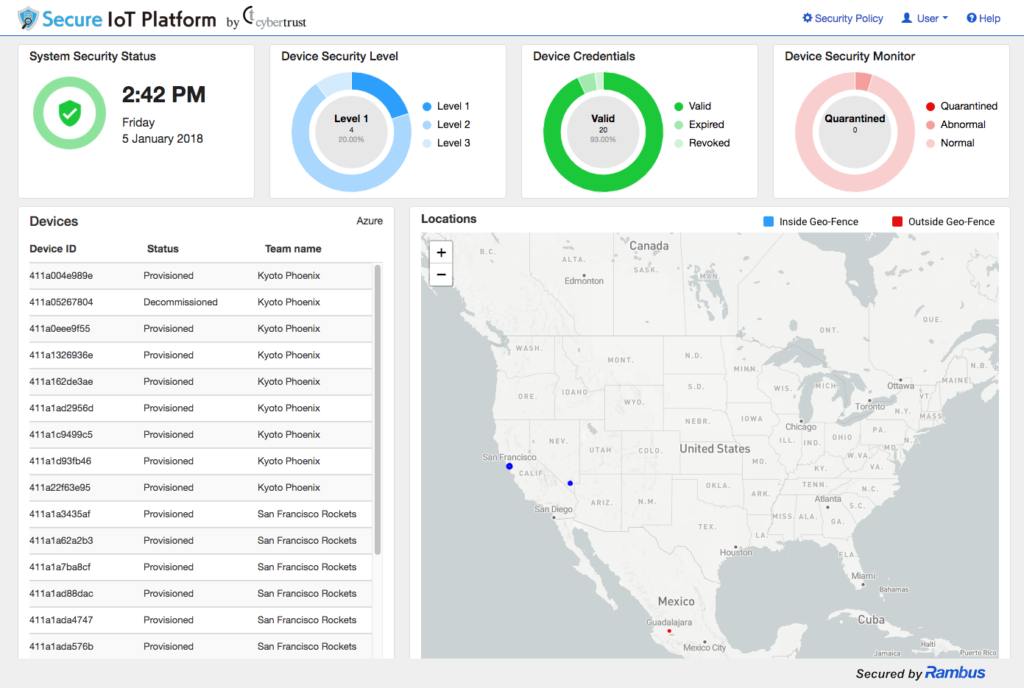
The “hamon®” consists of a wearable device that incorporates AGposs®, a silver fiber based yarn, that enables biometric information monitoring, such as ECG, heartrate, and daily activity. Additionally, the hamon service enables visualization of real-time data during an athlete’s training that includes analysis of training content and vital data in real-time, to help professional athletes maximize their performance.
hamon’s Security Features
Although this service can be utilized flexibly in all types of environments, a mechanism for strengthening security, such as software update and terminal authentication, is required as a vulnerability countermeasure to prevent threats from external networks. Thanks to the Cybertrust platform and Rambus service, the hamon can deliver easy visualization and automation of device security management and monitoring for IT administrators.
Speaking about IoT security, Mitsufuji President Mitera said that “Security is important than anything else when ensuring the required confidentiality of biological information. We hope to adopt Cybertrust and Rambus ‘Secure IoT platform’ to build a robust security foundation on which we can safely offer the ‘hamon®’ service.”
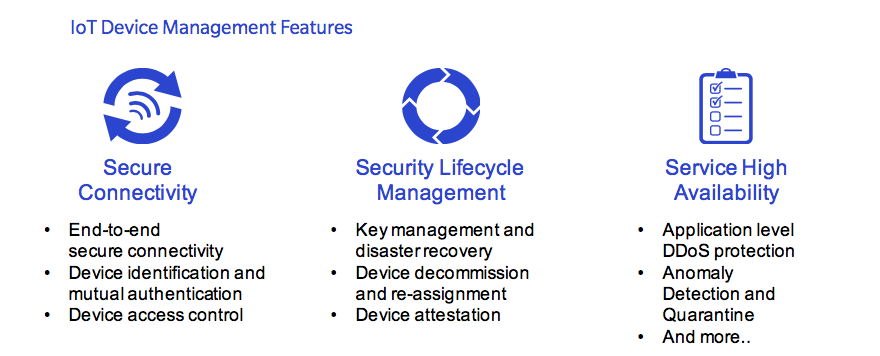
Rambus CryptoManager IoT Security Service is a turnkey security service for IoT Service providers and OEMs. Running on the Microsoft Azure IoT cloud service platform or AWS IoT platform, our one-stop-shop solution provides seamless device-to-cloud secure connectivity, device lifecycle management, and advanced device monitoring capabilities to protect service high-availability and help mitigate a variety of attacks including distributed denial of service (DDoS).
The IoT Security Service reduces the risk of devices being hijacked, copied, re-purposed, or even disabled, by a remote attacker by leveraging strong authentication between the device and service.
What to expect at CES
At CES 2018, the product will provide visual data of athletes’ performances to their coach and trainers along with the security monitoring of the training devices by the team IT administrators. Those in professional team sports understand the necessity of quick decisions based on real-time, objective data to maximize their performance.
Coaches can use the device to analyze training content and vital data at real-time for optimization of performance and manage signs of excessive stress to properly control the training contents to prevent injuries. IT administrators can monitor the status of multiple devices in real time from remote locations and, in case of abnormality, respond in real time from remote locations. There is a possibility for the platform to expand beyond sports into factory work and medicine.
Mr. Mitera hopes that, “in the coming years, with the support from the two companies,” Mitsufuji looks forward to providing “more users the opportunity to utilize the IoT devices with confidence on a global scale.”
Rambus Reports Third Quarter 2017 Financial Results
- Revenue of $99.1 million, up 10% year over year
- GAAP diluted net income per share of $0.07; non-GAAP diluted net income per share of $0.19
- Announced industry’s first silicon-proven server DIMM buffer chipset capable of achieving the speeds expected for next-generation DDR5
- Teamed up with eftpos domestic debit card network in Australia to support roll out of Apple Pay with tokenization software
SUNNYVALE, Calif. – October 23, 2017 – Rambus Inc. (NASDAQ:RMBS) today reported financial results for the third quarter ended September 30, 2017. Total revenue for the quarter was $99.1 million, 10% higher than a year ago, with GAAP diluted net income per share of $0.07 and non-GAAP diluted net income per share of $0.19. Total revenue for the nine months ended September 30, 2017 was $291.2 million, 22% higher than a year ago.
“We continue to demonstrate our leadership and execution on strategic programs with the industry’s first functional server DIMM buffer chipset to reach the speeds targeted for next-generation DDR5 and the integration of our Token Service Provider software at eftpos to support the roll out of Apple Pay in Australia,” said Dr. Ron Black, chief executive officer of Rambus. “We are excited by our progress, with strong execution on strategic programs for the data center and mobile edge markets, as we continue to deliver profitable growth.”
Business Review
In our Memory and Interfaces Division, we continue to demonstrate our technology leadership with the announcement of the industry’s first functional silicon of a server DIMM buffer chipset capable of achieving the speeds expected for next-generation DDR5. This represented an important milestone for both the company and the market, as it puts Rambus in a leadership position and provides an early path to market readiness and adoption for future data center solutions. The IP cores team extended its portfolio of high-speed interfaces for data center and enterprise applications with the addition of 16G and 30G SerDes IP cores on GLOBALFOUNDRIES 14nm FX-14™ ASIC platform. In addition, and as part of the ongoing ecosystem development to ease integration and accelerate adoption, we validated the interoperability of our memory PHYs with Northwest Logic and ARM memory controllers.
Our Security Division, which consists of our cryptography, mobile payments and smart ticketing businesses, had a strong quarter with the Cryptography team demonstrating the CryptoManager IoT Security Service on a leading cloud platform to enable secure device connectivity, monitoring and provisioning. In addition, we announced Cryptography will partner with SiFive to make our cryptography technology available for the SiFive Freedom platform, easing the path to designing innovative and cost-effective SoCs in the open and growing RISC-V hardware ecosystem. For mobile payments, we continue to gain traction for our tokenization solutions, teaming with eftpos, a leading debit card network in Australia, to support the roll out of Apple Pay to their debit card users with our Token Service Provider software.
| Financial Review | GAAP | Non-GAAP(1) | ||
| (In millions, except for percentages and per share amounts) | Three Months Ended September 30, | Three Months Ended September 30, | ||
| 2017 | 2016 | 2017 | 2016 | |
| Revenue | $ 99.1 | $ 89.9 | $ 99.1 | $ 89.9 |
| Total operating costs and expenses | $ 82.1 | $ 78.1 | $ 64.6 | $ 60.8 |
| Operating income | $ 17.0 | $ 11.8 | $ 34.5 | $ 29.1 |
| Operating margin | 17% | 13% | 35% | 32% |
| Net Income | $ 7.7 | $ 4.5 | $ 21.6 | $ 18.0 |
| Diluted net income per share | $ 0.07 | $ 0.04 | $ 0.19 | $ 0.16 |
| Total cash and marketable securities | $ 183.6 | $ 150.8 | $ 183.6 | $ 150.8 |
| Total assets | $ 824.1 | $ 800.3 | $ 824.1 | $ 800.3 |
| Total stockholders’ equity | $ 589.5 | $ 552.8 | $ 589.5 | $ 552.8 |
| Financial Review | GAAP | Non-GAAP(1) | ||
| (In millions, except for percentages and per share amounts) | Nine Months Ended September 30, | Nine Months Ended September 30, | ||
| 2017 | 2016 | 2017 | 2016 | |
| Revenue | $ 291.2 | $ 239.0 | $ 291.2 | $ 239.0 |
| Total operating costs and expenses | $ 252.5 | $ 205.9 | $ 200.7 | $ 160.3 |
| Operating income | $ 38.7 | $ 33.1 | $ 90.5 | $ 78.7 |
| Operating margin | 13% | 14% | 31% | 33% |
| Net Income | $ 13.3 | $ 10.3 | $ 56.3 | $ 49.3 |
| Diluted net income per share | $ 0.12 | $ 0.09 | $ 0.49 | $ 0.44 |
| (1) See “Supplemental Reconciliation of GAAP to Non-GAAP Results” and “Reconciliation of Other GAAP to Non-GAAP Items” tables included below. Note that the applicable non-GAAP measures are presented and that revenue and the balance sheet items are solely presented on a GAAP basis. | ||||
Revenue for the quarter was $99.1 million due to execution in our Security Division and continued strength in our licensing program. As a result of our execution in both businesses, revenue for our Memory and Interface Division was up 9% year over year and revenue for our Security Division was up 17% year over year. GAAP total operating costs and expenses were below the low end of our expectations, yielding $0.07 of GAAP net income per share, at the high end of our expectations. We had non-GAAP net income per share of $0.19, at the high end of our expectations.
Cash, cash equivalents, and marketable securities as of September 30, 2017 were $183.6 million, an increase of $15.7 million from June 30, 2017, mainly due to cash generated from operating activities of approximately $15 million. Adjusted EBITDA for the quarter was $37.8 million.
| (In millions, except per share amounts) | GAAP | Non-GAPP(1) | ||
| Revenue: | $98 – $104 | $98 – $104 | ||
| Total operating costs and expenses | $88 – $83 | $69 – $64 | ||
| Operating income | $11 – $22 | $29 – $40 | ||
| Diluted net income per share | $0.04 – $0.11 | $0.16 – $0.22 | ||
| (1) See “Reconciliation of GAAP Forward Looking Estimates to Non-GAAP Forward Looking Estimates” tables included below. Note that the applicable non-GAAP measures are presented and that revenue is solely presented on a GAAP basis. | ||||
For the fourth quarter of 2017, the Company expects revenue to be between $98 million and $104 million. Revenue is not without risk and achieving revenue in this range will require that the Company sign customer agreements for patent licensing, various product sales, mobile payments software and solutions licensing among other matters. The Company also expects operating costs and expenses to be between $83 million and $88 million, and diluted net income per share to be between $0.04 and $0.11. Additionally, the Company expects non-GAAP operating costs and expenses to be between $64 million and $69 million, and non-GAAP diluted net income per share to be between $0.16 and $0.22. These non-GAAP expectations assume non-GAAP interest and other income and expense of $1.3 million, tax rate of 35% (refer to non-GAAP financial information below – income tax adjustments) and diluted share count of 114 million, and exclude stock-based compensation expense ($8 million), amortization expense ($11 million), and non-cash interest expense on convertible notes ($2 million).
Conference Call:
Rambus management will discuss the results of the quarter during a conference call scheduled for 2:00pm PT today. The call, audio and slides will be available online at investor.rambus.com and a replay will be available for the next week at the following numbers: (855) 859-2056 (domestic) or (404) 537-3406 (international) with ID#98501879.
Forward-Looking Statements
This release contains forward-looking statements under the Private Securities Litigation Reform Act of 1995 including those relating to Rambus’ expectations regarding our new product and service offerings, growth for 2017 and financial guidance for the fourth quarter of 2017, including revenue, operating costs and expenses, earnings per share and estimated, fixed, long-term projected tax rates, both on a GAAP and non-GAAP basis as appropriate. Such forward-looking statements are based on current expectations, estimates and projections, management’s beliefs and certain assumptions made by Rambus’ management. Actual results may differ materially. Rambus’ business generally is subject to a number of risks which are described more fully in Rambus’ periodic reports filed with the Securities and Exchange Commission. Rambus undertakes no obligation to update forward-looking statements to reflect events or circumstances after the date hereof.
Overview of Non-GAAP Results
In the commentary set forth above and in the financial statements included in this earnings release, the Company presents the following non-GAAP financial measures: operating costs and expenses, operating margin, operating income (loss), net income (loss), diluted net income (loss) per share and Adjusted EBITDA. In computing each of these non-GAAP financial measures, the following items were considered as discussed below: stock-based compensation expenses, acquisition-related transaction costs and retention bonus expense, amortization expenses, non-cash interest expense and certain other one-time adjustments. The non-GAAP financial measures disclosed by the Company should not be considered a substitute for, or superior to, financial measures calculated in accordance with GAAP, and the financial results calculated in accordance with GAAP and reconciliations from these results should be carefully evaluated. Management believes the non-GAAP financial measures are appropriate for both its own assessment of, and to show investors, how the Company’s performance compares to other periods. The non-GAAP financial measures used by the Company may be calculated differently from, and therefore may not be comparable to, similarly titled measures used by other companies. Reconciliation from GAAP to non-GAAP results is included in the financial statements contained in this release.
The Company’s non-GAAP financial measures reflect adjustments based on the following items:
Stock-based compensation expense. These expenses primarily relate to employee stock options, employee stock purchase plans, and employee non-vested equity stock and non-vested stock units. The Company excludes stock-based compensation expense from its non-GAAP measures primarily because such expenses are non-cash expenses that the Company does not believe are reflective of ongoing operating results. Additionally, given the fact that other companies may grant different amounts and types of equity awards and may use different option valuation assumptions, excluding stock-based compensation expense permits more accurate comparisons of the Company’s results with peer companies.
Acquisition-related transaction costs and retention bonus expense. These expenses include all direct costs of certain acquisitions and the current periods’ portion of any retention bonus expense associated with the acquisitions. The Company excludes these expenses in order to provide better comparability between periods.
Purchase accounting adjustment for inventory fair value step-up. These adjustments are the result of accounting for certain business acquisitions and are excluded because such adjustments are non-recurring. Additionally, the Company excludes these expenses in order to provide better comparability between periods.
Amortization expense. The Company incurs expenses for the amortization of intangible assets acquired in acquisitions. The Company excludes these items because these expenses are not reflective of ongoing operating results in the period incurred. These amounts arise from the Company’s prior acquisitions and have no direct correlation to the operation of the Company’s core business.
Non-cash interest expense on convertible notes. The Company incurs non-cash interest expense related to its convertible notes. The Company excludes non-cash interest expense related to its convertible notes to provide more accurate comparisons of the Company’s results with other peer companies and to more accurately reflect the Company’s ongoing operations.
Income tax adjustments. For purposes of internal forecasting, planning and analyzing future periods that assume net income from operations, the Company estimates a fixed, long-term projected tax rate of approximately 35 percent for both 2017 and 2016, which consists of estimated U.S. federal and state tax rates, and excludes tax rates associated with certain items such as withholding tax, tax credits, deferred tax asset valuation allowance and the release of any deferred tax asset valuation allowance. Accordingly, the Company has applied these tax rates to its non-GAAP financial results for all periods in the relevant years to assist the Company’s planning for future periods. The Company has provided below a reconciliation of its GAAP provision for income taxes and GAAP effective tax rate to the assumed non-GAAP provision for income taxes and non-GAAP effective tax rate.
On occasion in the future, there may be other items, such as impairments or significant gains or losses from contingencies, that the Company may exclude in deriving its non-GAAP financial measures if it believes that doing so is consistent with the goal of providing useful information to investors and management.
| Rambus Inc. Condensed Consolidated Balance Sheets (In thousands) (Unaudited) |
|||
|---|---|---|---|
| September 30, 2017 |
December 31, 2016 |
||
| ASSETS | |||
| Current assets: | |||
| Cash and cash equivalents | $ 182,345 | $ 135,294 | |
| Marketable securities | 1,287 | 36,888 | |
| Accounts receivable | 49,799 | 21,099 | |
| Inventories | 5,015 | 5,633 | |
| Prepaids and other current assets | 10,998 | 17,867 | |
| Total current assets | 249,444 | 216,781 | |
| Intangible assets, net | 102,545 | 132,388 | |
| Goodwill | 209,318 | 204,794 | |
| Property, plant and equipment, net | 54,035 | 58,442 | |
| Deferred tax assets | 206,503 | 168,342 | |
| Other assets | 2,283 | 2,749 | |
| Total assets | $ 824,128 | $ 783,496 | |
| LIABILITIES & STOCKHOLDERS’ EQUITY | |||
| Current liabilities: | |||
| Accounts payable | $ 7,016 | $ 9,793 | |
| Accrued salaries and benefits | 12,278 | 14,177 | |
| Deferred revenue | 21,224 | 16,932 | |
| Convertible notes, short-term | 131,490 | – | |
| Other current liabilities | 10,731 | 10,399 | |
| Total current liabilities | 182,739 | 51,301 | |
| Long-term liabilities: | |||
| Convertible notes, long-term | – | 126,167 | |
| Long-term imputed financing obligation | 37,471 | 38,029 | |
| Other long-term liabilities | 14,381 | 15,217 | |
| Total long-term liabilities | 51,852 | 179,413 | |
| Total stockholders’ equity | 589,537 | 552,782 | |
| Total liabilities and stockholders’ equity | $ 824,128 | $ 783,496 | |
| Rambus Inc. Condensed Consolidated Statements of Operations (In thousands, except per share amounts) (Unaudited) |
||||
|---|---|---|---|---|
| Three Months Ended September 30, |
Nine Months Ended September 30, |
|||
| 2017 | 2016 | 2017 | 2016 | |
| Revenue: | ||||
| Royalties | $72,787 | $68,298 | $211,733 | $194,010 |
| Product revenue | 8,661 | 7,092 | 27,966 | 14,306 |
| Contract and other revenue | 17,686 | 14,465 | 51,506 | 30,722 |
| Total revenue | 99,134 | 89,855 | 291,205 | 239,038 |
| Operating costs and expenses: | ||||
| Cost of product revenue (1) | 5,152 | 7,031 | 17,882 | 12,581 |
| Cost of contract and other revenue | 14,456 | 12,393 | 43,274 | 33,139 |
| Research and development (1) | 36,196 | 33,820 | 109,718 | 91,100 |
| Sales, general and administrative (1) | 26,799 | 24,795 | 82,122 | 69,679 |
| Gain from sale of intellectual property | (479) | — | (479) | — |
| Gain from settlement | — | — | — | (579) |
| Total operating costs and expenses | 82,124 | 78,039 | 252,517 | 205,920 |
| Operating income | 17,010 | 11,816 | 38,688 | 33,118 |
| Interest income and other income (expense), net | 208 | 142 | 491 | 1,522 |
| Interest expense | (3,287) | (3,193) | (9,754) | (9,497) |
| Interest and other income (expense), net | (3,079) | (3,051) | (9,263) | (7,975) |
| Income before income taxes | 13,931 | 8,765 | 29,425 | 25,143 |
| Provision for income taxes | 6,236 | 4,254 | 16,119 | 14,878 |
| Net income | $7,695 | $4,511 | $13,306 | $10,265 |
| Net income per share: | ||||
| Basic | $0.07 | $0.04 | $0.12 | $0.09 |
| Diluted | $0.07 | $0.04 | $0.12 | $0.09 |
| Weighted average shares used in per share calculation | ||||
| Basic | 109,555 | 110,214 | 110,353 | 109,951 |
| Diluted | 113,119 | 113,723 | 113,861 | 112,805 |
| (1) Total stock-based compensation expense for the three and nine months ended September 30, 2017 and 2016 is presented as follows: | ||||
| Three Months Ended September 30, |
Nine Months Ended September 30, |
|||
| 2017 | 2016 | 2017 | 2016 | |
| Cost of product revenue | $ 20 | $ 14 | $ 53 | $ 42 |
| Research and development | $ 2,969 | $ 2,337 | $ 9,048 | $ 6,526 |
| Sales, general and administrative | $ 3,975 | $ 3,092 | $ 11,068 | $ 8,788 |
| Supplemental Reconciliation of GAAP to Non-GAAP Results (In thousands) (Unaudited) |
||||||
|---|---|---|---|---|---|---|
| Three Months Ended | Nine Months Ended | |||||
| September 30, 2017 | June 30, 2017 | September 30, 2016 | September 30, 2017 | September 30, 2016 | ||
| Operating costs and expenses | $82,124 | $86,476 | $78,039 | $252,517 | $205,920 | |
| Adjustments: | ||||||
| Stock-based compensation expense | (6,964) | (6,609) | (5,443) | (20,169) | (15,356) | |
| Acquisition-related transaction costs and retention bonus expense | (47) | (90) | (441) | (218) | (3,038) | |
| Purchase accounting adjustment for inventory fair value step-up | — | — | (1,168) | — | (1,168) | |
| Amortization expense | (10,498) | (10,450) | (10,174) | (31,436) | (26,045) | |
| Non-GAAP operating costs and expenses | $64,615 | $69,327 | $60,813 | $200,694 | $160,313 | |
| Operating income | $ 17,010 | $ 8,244 | $ 11,816 | $ 38,688 | $ 33,118 | |
| Adjustments: | ||||||
| Stock-based compensation expense | 6,964 | 6,609 | 5,443 | 20,169 | 15,356 | |
| Acquisition-related transaction costs and retention bonus expense | 47 | 90 | 441 | 218 | 3,038 | |
| Purchase accounting adjustment for inventory fair value step-up | — | — | 1,168 | — | 1,168 | |
| Amortization expense | 10,498 | 10,450 | 10,174 | 31,436 | 26,045 | |
| Non-GAAP operating income | $ 34,519 | $ 25,393 | $ 29,042 | $ 90,511 | $ 78,725 | |
| Income before income taxes | $ 13,931 | $ 5,112 | $ 8,765 | $ 29,425 | $ 25,143 | |
| Adjustments: | ||||||
| Stock-based compensation expense | 6,964 | 6,609 | 5,443 | 20,169 | 15,356 | |
| Acquisition-related transaction costs and retention bonuses expense | 47 | 90 | 441 | 218 | 3,038 | |
| Purchase accounting adjustment for inventory fair value step-up | — | — | 1,168 | — | 1,168 | |
| Amortization expense | 10,498 | 10,450 | 10,174 | 31,436 | 26,045 | |
| Non-cash interest expense on convertible notes | 1,801 | 1,774 | 1,700 | 5,324 | 5,026 | |
| Non-GAAP income before income taxes | $ 33,241 | $ 24,035 | $ 27,691 | $ 86,572 | $ 75,776 | |
| GAAP provision for income taxes | 6,236 | 2,507 | 4,254 | 16,119 | 14,878 | |
| Adjustment to GAAP provision for income taxes | 5,398 | 5,905 | 5,438 | 14,181 | 11,644 | |
| Non-GAAP provision for income taxes | 11,634 | 8,412 | 9,692 | 30,300 | 26,522 | |
| Non-GAAP net income | $ 21,607 | $ 15,623 | $ 17,999 | $ 56,272 | $ 49,254 | |
| Non-GAAP basic net income per share | $ 0.20 | $ 0.14 | $ 0.16 | $ 0.51 | $ 0.45 | |
| Non-GAAP diluted net income per share | $ 0.19 | $ 0.14 | $ 0.16 | $ 0.49 | $ 0.44 | |
| Weighted average shares used in non-GAAP per share calculation: | ||||||
| Basic | 109,555 | 110,060 | 110,214 | 110,353 | 109,951 | |
| Diluted | 113,119 | 112,565 | 113,723 | 113,861 | 112,805 | |
| Supplemental Reconciliation of GAAP to Non-GAAP Effective Tax Rate (1) | ||||||
|---|---|---|---|---|---|---|
| Three Months Ended | Nine Months Ended | |||||
| September 30, 2017 | June 30, 2017 | September 30, 2016 | September 30, 2017 | September 30, 2016 | ||
| GAAP effective tax rate | 45% | 49% | 49% | 55% | 59% | |
| Adjustment to GAAP effective tax rate | (10)% | (14)% | (14)% | (20)% | (24)% | |
| Non-GAAP effective tax rate | 35% | 35% | 35% | 35% | 35% | |
| (1) For purposes of internal forecasting, planning and analyzing future periods that assume net income from operations, the Company estimates a fixed, long-term projected tax rate of approximately 35 percent for both 2017 and 2016, which consists of estimated U.S. federal and state tax rates, and excludes tax rates associated with certain items such as withholding tax, tax credits, deferred tax asset valuation allowance and the release of any deferred tax asset valuation allowance. Accordingly, the Company has applied these tax rates to its non-GAAP financial results for all periods in the relevant year to assist the Company’s planning for future periods. | ||||||
| Reconciliation of Other GAAP to Non-GAAP Items (In thousands, except percentages) (Unaudited) |
|||||
|---|---|---|---|---|---|
| GAAP | Non-GAAP | ||||
| Three Months Ended September 30, |
Three Months Ended September 30, |
||||
| 2017 | 2016 | 2017 | 2016 | ||
| Revenue (i) | $ 99,134 | $ 89,855 | $ 99,134 | $ 89,855 | |
| Operating income (ii) | 17,010 | 11,816 | 34,519 | 29,042 | |
| Operating margin (ii / i) | 17% | 13% | 35% | 32% | |
| GAAP | Non-GAAP | |||
| Nine Months Ended September 30, |
Nine Months Ended September 30, |
|||
| 2017 | 2016 | 2017 | 2016 | |
| Revenue (i) | $ 291,205 | $ 239,038 | $ 291,205 | $ 239,038 |
| Operating income (ii) | 38,688 | 33,118 | 90,511 | 78,725 |
| Operating margin (ii / i) | 13% | 14% | 31% | 33% |
| Three Months Ended September 30, |
|||||
| 2017 | 2016 | ||||
| Net income | $ 7,695 | $ 4,511 | |||
| Add back: | |||||
| Interest and other income (expense), net | 3,079 | 3,051 | |||
| Provision for income taxes | 6,236 | 4,254 | |||
| Depreciation expense | 3,249 | 3,423 | |||
| Amortization expense | 10,498 | 10,174 | |||
| EBITDA (1) | $ 30,757 | $ 25,413 | |||
| Adjustments: | |||||
| Stock-based compensation expense | 6,964 | 5,443 | |||
| Acquisition-related transaction costs and retention bonus expense | 47 | 441 | |||
| Purchase accounting adjustment for inventory fair value step-up | — | 1,168 | |||
| Adjusted EBITDA (2) | $ 37,768 | $ 32,465 | |||
| (1) EBITDA is a non-GAAP measure that management uses to evaluate the cash generating capacity of the company. The most directly comparable GAAP measure is net income. EBITDA is net income adjusted for net interest expense, income taxes, and depreciation and amortization. It should not be considered as an alternative to net income computed under GAAP. (2) Adjusted EBITDA excludes the impact of other non-GAAP adjustments indicated in the above tables. |
|||||
| Reconciliation of GAAP Forward Looking Estimates to Non-GAAP Forward Looking Estimates (In millions, except per share amounts) (Unaudited) |
|||||
|---|---|---|---|---|---|
| Three Months Ended December 31, 2017 |
|||||
| Low | High | ||||
| Forward-looking operating costs and expenses | $ 87.5 | $ 82.5 | |||
| Adjustments: | |||||
| Stock-based compensation expense | (7.5) | (7.5) | |||
| Amortization expense | (11.0) | (11.0) | |||
| Forward-looking Non-GAAP operating costs and expenses | $ 69.0 | $ 64.0 | |||
| Forward-looking operating income | $ 10.5 | $ 21.5 | |||
| Adjustments: | |||||
| Stock-based compensation expense | 7.5 | 7.5 | |||
| Amortization expense | 11.0 | 11.0 | |||
| Forward-looking Non-GAAP operating income | $ 29.0 | $ 40.0 | |||
| Forward-looking income before income taxes | $ 7.5 | $ 18.5 | |||
| Adjustments: | |||||
| Stock-based compensation expense | 7.5 | 7.5 | |||
| Amortization expense | 11.0 | 11.0 | |||
| Non-cash interest expense on convertible notes | 1.7 | 1.7 | |||
| Forward-looking Non-GAAP income before income taxes | $ 27.7 | $ 38.7 | |||
| Forward-looking GAAP provision for income taxes | 2.6 | 6.5 | |||
| Adjustment to Forward-looking GAAP provision for income taxes | 7.1 | 7.0 | |||
| Forward-looking Non-GAAP provision for income taxes | 9.7 | 13.5 | |||
| Forward-looking Non-GAAP net income | $ 18.0 | $ 25.2 | |||
| Forward-looking Non-GAAP basic net income per share | $ 0.16 | $ 0.23 | |||
| Forward-looking Non-GAAP diluted net income per share | $ 0.16 | $ 0.22 | |||
| Weighted average shares used in forward-looking Non-GAAP per share calculation: | |||||
| Basic | 111.0 | 111.0 | |||
| Diluted | 114.0 | 114.0 | |||
The challenge of securing smart homes
Understanding smart homes
Although there is little consensus regarding a specific definition, the “Internet of Things” generally refers to the multiple networks of devices (“things”) that communicate with each other via wired and wireless network protocols – without direct human interaction. IoT-enabled devices help facilitate the rapid and efficient transfer of data used to support a wide range of activities and operations. The IoT encompasses a multitude of complementary network of things in various service sectors, such as efficient energy production and distribution, M2M and other industrial and manufacturing controls, smart city water and transport management, smart homes, and health care.
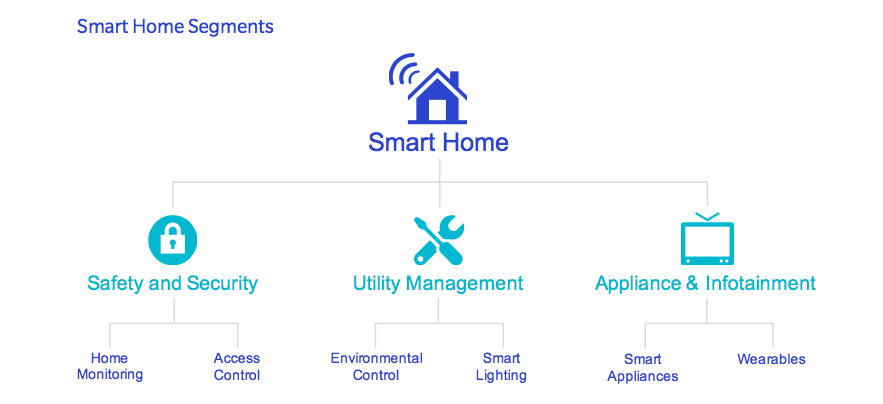
Like the IoT, the term smart home has been widely, yet inconsistently used. However, in an effort to standardize the meaning of the term, Coldwell Banker Real Estate and CNET have defined a smart home as “a [residence] that is equipped with network-connected products (aka ‘smart products’) connected via Wi-Fi, Bluetooth or similar protocols for controlling, automating, and optimizing functions such as temperature, lighting, security, safety or entertainment, either remotely by a phone, tablet, computer or a separate system within the home itself.”
The U.S. smart home market
U.S. smart home penetration was reported at 32.5 % in 2017, and is expected to hit 60.7 % in 2021. Some of the most popular smart home products include connected cameras (40%) and video doorbells (26%). Family safety (63%) and convenience (54%) are currently the top motivators for adopting smart home technology, which allows residents to more precisely manage cooling, heating, electricity, gas, water, and other resources. Pet owners also benefit from smart home technology, as cameras can be used to monitor dogs and cats, while feeding tools are automated to ensure precise portion control. As an example, the success of Amazon’s Echo smart speaker and Nest’s intelligent products such as thermostats and smoke detectors illustrate the growing popularity of smart home devices that are designed to anticipate consumer needs.

Smart home security challenges
An estimated 80% of IoT devices are vulnerable to a wide range of attacks. Clearly, connecting traditionally ‘stand-alone’ smart devices such as lights, appliances and locks introduces numerous cyber security risks. For example, a connected home door lock is designed to collect and transfer data to the cloud about the entry and exit habits of family members. This can be exploited if the smart door lock device is compromised by cyber criminals.
Similarly, a smart thermostat that collects usage data for real-time energy optimization must be designed to protect information from unauthorized access that could indicate a home is empty – making it an ideal target for burglars. Even connected baby monitors are vulnerable to digital intruders, as a number of horrified parents belatedly discovered when hackers spoke to their young children via compromised devices.
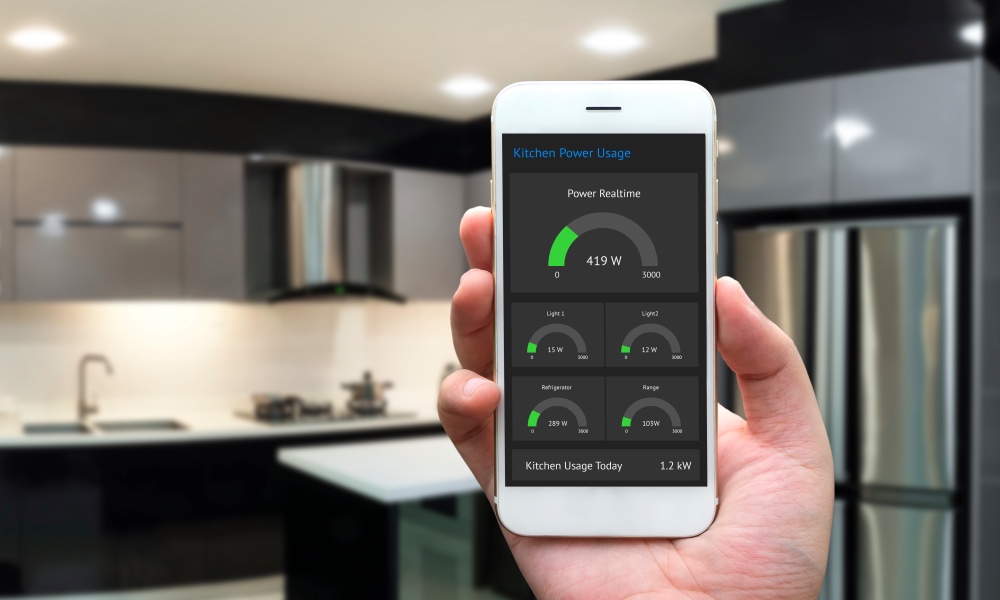
There is clearly no shortage of threats targeting IoT devices. Indeed, vulnerable devices can be hijacked and even physically disabled, while unencrypted or unverified data transmissions can be intercepted, leaked or spoofed. A leak or deliberate falsification of sensitive customer data will inevitably damage a brand and decrease consumer confidence in smart home devices. Despite the real-world risks, service providers and OEMs are understandably concerned that implementation of a comprehensive IoT security solution could potentially incur additional costs and delay time to market. As such, the most effective IoT security solution is one that does not negatively impact profitability or time to market. Put simply, a practical, simple and secure solution that can be easily and widely adopted by service providers is far more effective than a ‘super solution’ with only limited adoption.
Rambus IoT Device Management
The Rambus IoT Device Management is a turnkey security service for smart home service providers and OEMs. Our one-stop shop solution provides seamless device-to-cloud secure connectivity, protects service high-availability and helps mitigate a variety of attacks, including distributed denial of service (DDoS). Rambus CryptoManager IoT Device Management uses pre-provisioned unique device keys to automatically identify and authenticate a device. The device is then securely provisioned by IoT Device Management over the air, creating a secure communication channel between the device and the service. Our one-stop-shop solution also offers device lifecycle management and advanced device monitoring capabilities.
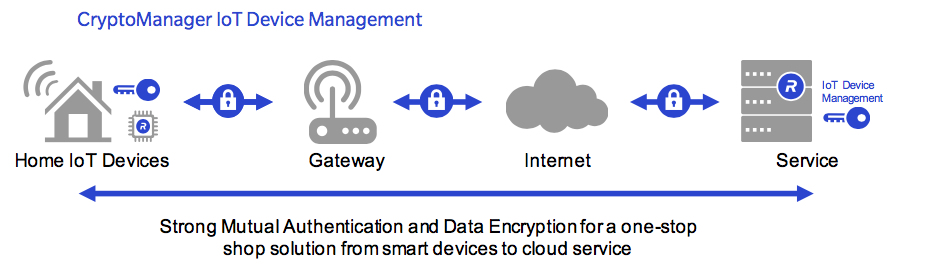
The CryptoManager IoT Device Management solution comprises multiple software modules that are pre-integrated with the device and the selected cloud Platform as a Service (PaaS) via their relevant SDKs. When a device is powered up and connected to the internet, it automatically connects to the IoT Device Management service, seamlessly authenticates and provisions relevant security credentials.
In conclusion, the widespread use of connected smart home devices has created an attractive target for cyber criminals and other unscrupulous operators. Smart home security should therefore be viewed as a primary design goal, rather than a tertiary afterthought. To be sure, consumers increasingly expect their devices to be protected out of the box, with seamless over-the air-updates (OTA) implemented securely. However, OEMs need to be assured that securing smart home devices is not an insurmountable goal that negatively impacts profitability or time to market. As such, smart home devices should be protected by a turnkey security solution that can be easily implemented, maintained and upgraded to meet the evolving challenges of a dynamic threat landscape.
Interested in learning more about securing smart homes? You can download our white paper below on the subject.