The Rambus PCI Express® (PCIe®) 6.2 Switch is a customizable, multiport embedded switch for PCIe designed for ASIC implementations. It enables the connection of one upstream port and multiple downstream ports as a fully configurable interface subsystem. It is backward compatible to PCIe 5.0.
Rambus Reports Third Quarter 2024 Financial Results
- Delivered $66.4 million in product revenue, up 17% sequentially and 27% year over year
- Achieved strong sequential earnings growth and generated excellent cash from operations of $62.1 million
- Unveiled industry-first complete chipsets for next-generation, industry-standard DDR5 MRDIMMs and RDIMMs for the data center and AI
SAN JOSE, Calif. – October 28, 2024 – Rambus Inc. (NASDAQ:RMBS), a provider of industry-leading chips and IP making data faster and safer, today reported financial results for the third quarter ended September 30, 2024. GAAP revenue for the third quarter was $145.5 million, licensing billings were $65.4 million, product revenue was $66.4 million, and contract and other revenue was $15.0 million. The Company also generated $62.1 million in cash provided by operating activities in the third quarter.
“We delivered strong sequential growth in Q3, fueled by a double-digit increase in product revenue, and generated excellent cash from operations,” said Luc Seraphin, chief executive officer of Rambus. “Building on our strong execution and strategic investment in new leadership products, we introduced the industry’s first complete chipsets for industry-standard DDR5 MRDIMM 12800 and RDIMM 8000 to address the rising performance needs of the data center and AI. These new chips represent a significant expansion of our addressable market and support the company’s long-term growth.”
| Quarterly Financial Review – GAAP | Three Months Ended September 30, |
||
| (In millions, except for percentages and per share amounts) | 2024 | 2023 | |
| Revenue | |||
| Product revenue | $66.4 | $52.2 | |
| Royalties | 64.1 | 28.9 | |
| Contract and other revenue | 15.0 | 24.2 | |
| Total revenue | 145.5 | 105.3 | |
| Cost of product revenue | 24.6 | 19.4 | |
| Cost of contract and other revenue | 0.8 | 1.3 | |
| Amortization of acquired intangible assets (included in total cost of revenue) | 2.8 | 3.3 | |
| Total operating expenses (benefits) (1) | 62.7 | (23.6) | |
| Operating income | $54.6 | $104.9 | |
| Operating margin | 38 % | 100 % | |
| Net income | $48.7 | $103.2 | |
| Diluted net income per share | $0.45 | $0.93 | |
| Net cash provided by operating activities | $62.1 | $51.6 | |
_________________________________________
(1) Includes amortization of acquired intangible assets of approximately $0.1 million and $0.3 million for the three months ended September 30, 2024 and 2023, respectively.
| Quarterly Financial Review – Supplemental Information(1) | Three Months Ended September 30, |
||
| (In millions) | 2024 | 2023 | |
| Licensing billings (operational metric) (2) | $65.4 | $57.9 | |
| Product revenue (GAAP) | $66.4 | $52.2 | |
| Contract and other revenue (GAAP) | $15.0 | $24.2 | |
| Non-GAAP cost of product revenue | $24.4 | $19.2 | |
| Cost of contract and other revenue (GAAP) | $0.8 | $1.3 | |
| Non-GAAP total operating expenses | $55.3 | $52.4 | |
| Non-GAAP interest and other income (expense), net | $4.2 | $1.9 | |
| Diluted share count (GAAP) | 108 | 111 | |
_________________________________________
(1) See “Supplemental Reconciliation of GAAP to Non-GAAP Results” table included below.
(2) Licensing billings is an operational metric that reflects amounts invoiced to our licensing customers during the period, as adjusted for certain differences relating to advanced payments for variable licensing agreements.
GAAP revenue for the quarter was $145.5 million. The Company also had licensing billings of $65.4 million, product revenue of $66.4 million, and contract and other revenue of $15.0 million. The Company had total GAAP cost of revenue of $28.1 million and operating expenses of $62.7 million. The Company also had total non-GAAP operating expenses of $80.5 million (including non-GAAP cost of revenue of $25.2 million). The Company had GAAP diluted net income per share of $0.45. The Company’s basic share count was 107 million shares and its diluted share count was 108 million shares.
Cash, cash equivalents, and marketable securities as of September 30, 2024 were $432.7 million, which remained flat from June 30, 2024, mainly due to $62.1 million in cash provided by operating activities, offset by $50 million paid in connection with a share repurchase program and $9.9 million paid to acquire property, plant and equipment.
2024 Fourth Quarter Outlook
The Company will discuss its full revenue guidance for the fourth quarter of 2024 during its upcoming conference call. The following table sets forth the fourth quarter outlook for other measures.
| (In millions) | GAAP | Non-GAAP (1) | |
| Licensing billings (operational metric) (2) | $57 – $63 | $57 – $63 | |
| Product revenue (GAAP) | $72 – $78 | $72 – $78 | |
| Contract and other revenue (GAAP) | $22 – $28 | $22 – $28 | |
| Total operating costs and expenses | $101 – $97 | $86 – $82 | |
| Interest and other income (expense), net | $4 | $4 | |
| Diluted share count | 108 | 108 |
_________________________________________
(1) See “Reconciliation of GAAP Forward-Looking Estimates to Non-GAAP Forward-Looking Estimates” table included below.
(2) Licensing billings is an operational metric that reflects amounts invoiced to our licensing customers during the period, as adjusted for certain differences relating to advanced payments for variable licensing agreements.
For the fourth quarter of 2024, the Company expects licensing billings to be between $57 million and $63 million. The Company also expects royalty revenue to be between $54 million and $60 million, product revenue to be between $72 million and $78 million, and contract and other revenue to be between $22 million and $28 million. Revenue is not without risk and achieving revenue in this range will require that the Company sign customer agreements for various product sales and solutions licensing, among other matters.
The Company also expects operating costs and expenses to be between $101 million and $97 million. Additionally, the Company expects non-GAAP operating costs and expenses to be between $86 million and $82 million. These expectations also assume a tax rate of 22% and a diluted share count of 108 million, and exclude stock-based compensation expense of $13 million and amortization of acquired intangible assets of $2 million.
Conference Call
The Company’s management will discuss the results of the quarter during a conference call scheduled for 2:00 p.m. PT today. The call, audio and slides will be available online at investor.rambus.com and a replay will be available for the next week at the following numbers: (866) 813-9403 (domestic) or (+1) 929-458-6194 (international) with ID# 719712.
Non-GAAP Financial Information
In the commentary set forth above and in the financial statements included in this earnings release, the Company presents the following non-GAAP financial measures: cost of product revenue, operating expenses and interest and other income (expense), net. In computing each of these non-GAAP financial measures, the following items were considered as discussed below: stock-based compensation expense, acquisition-related/divestiture costs and retention bonus expense, amortization of acquired intangible assets, restructuring and other charges (benefits), expense on abandoned operating leases, facility restoration costs, gain on divestiture, change in fair value of earn-out liability, impairment of assets, and certain other one-time adjustments. The non-GAAP financial measures disclosed by the Company should not be considered a substitute for, or superior to, financial measures calculated in accordance with GAAP, and the financial results calculated in accordance with GAAP and reconciliations from these results should be carefully evaluated. Management believes the non-GAAP financial measures are appropriate for both its own assessment of, and to show investors, how the Company’s performance compares to other periods. The non-GAAP financial measures used by the Company may be calculated differently from, and therefore may not be comparable to, similarly titled measures used by other companies. A reconciliation from GAAP to non-GAAP results is included in the financial statements contained in this release.
The Company’s non-GAAP financial measures reflect adjustments based on the following items:
Stock-based compensation expense. These expenses primarily relate to employee stock options, employee stock purchase plans, and employee non-vested equity stock and non-vested stock units. The Company excludes stock-based compensation expense from its non-GAAP measures primarily because such expenses are non-cash expenses that the Company does not believe are reflective of ongoing operating results. Additionally, given the fact that other companies may grant different amounts and types of equity awards and may use different option valuation assumptions, excluding stock-based compensation expense permits more accurate comparisons of the Company’s results with peer companies.
Acquisition-related/divestiture costs and retention bonus expense. These expenses include all direct costs of certain acquisitions, divestitures and the current periods’ portion of any retention bonus expense associated with the acquisitions. The Company excludes these expenses in order to provide better comparability between periods as they are related to acquisitions and divestitures and have no direct correlation to the Company’s operations.
Amortization of acquired intangible assets. The Company incurs expenses for the amortization of intangible assets acquired in acquisitions. The Company excludes these items because these expenses are not reflective of ongoing operating results in the period incurred. These amounts arise from the Company’s prior acquisitions and have no direct correlation to the operation of the Company’s core business.
Restructuring and other charges (recoveries). These charges (recoveries) may consist of severance, contractual retention payments, exit costs and other charges and are excluded because such charges (recoveries) are not directly related to ongoing business results and do not reflect expected future operating expenses.
Expense on abandoned operating leases. Reflects the expense on building leases that were abandoned. The Company excludes these charges because such charges are not directly related to ongoing business results and do not reflect expected future operating expenses.
Facility restoration costs. These charges consist of exit costs associated with our leased office space and are excluded because such charges are not directly related to ongoing business results and do not reflect expected future operating expenses.
Gain on divestiture. Reflects the gain on the sale of the Company’s PHY IP business. The Company excludes these charges (benefits) because such charges (benefits) are not directly related to ongoing business results and do not reflect expected future operating expenses (benefits).
Impairment of assets. These charges primarily consist of non-cash charges to property, plant and equipment assets, which are excluded because such charges are non-recurring and do not reduce the Company’s liquidity.
Change in fair value of earn-out liability. This change is due to adjustments to acquisition purchase consideration. The Company excludes these adjustments because such adjustments are not directly related to ongoing business results and do not reflect expected future operating expenses.
Income tax adjustments. For purposes of internal forecasting, planning and analyzing future periods that assume net income from operations, the Company estimates a fixed, long-term projected tax rate of approximately 22 percent and 24 percent for 2024 and 2023, respectively, which consists of estimated U.S. federal and state tax rates, and excludes tax rates associated with certain items such as withholding tax, tax credits, deferred tax asset valuation allowance and the release of any deferred tax asset valuation allowance. Accordingly, the Company has applied these tax rates to its non-GAAP financial results for all periods in the relevant years to assist the Company’s planning.
On occasion in the future, there may be other items, such as significant gains or losses from contingencies, that the Company may exclude in deriving its non-GAAP financial measures if it believes that doing so is consistent with the goal of providing useful information to investors and management.
Forward-Looking Statements
This release contains forward-looking statements under the Private Securities Litigation Reform Act of 1995, including those relating to Rambus’ expectations regarding business opportunities, the Company’s ability to deliver long-term, profitable growth, product and investment strategies, and the Company’s outlook and financial guidance for the fourth quarter of 2024 and related drivers, and the Company’s ability to effectively manage market challenges. Such forward-looking statements are based on current expectations, estimates and projections, management’s beliefs and certain assumptions made by the Company’s management. Actual results may differ materially. The Company’s business generally is subject to a number of risks which are described more fully in Rambus’ periodic reports filed with the Securities and Exchange Commission. The Company undertakes no obligation to update forward-looking statements to reflect events or circumstances after the date hereof.
Contact
Desmond Lynch
Senior Vice President, Finance and Chief Financial Officer
(408) 462-8000
[email protected]
Rambus Inc.
Condensed Consolidated Balance Sheets
(Unaudited)
| (In thousands) | September 30, 2024 |
December 31, 2023 |
|
| ASSETS | |||
| Current assets: | |||
| Cash and cash equivalents | $113,980 | $94,767 | |
| Marketable securities | 318,717 | 331,077 | |
| Accounts receivable | 87,198 | 82,925 | |
| Unbilled receivables | 30,778 | 50,872 | |
| Inventories | 48,905 | 36,154 | |
| Prepaids and other current assets | 12,435 | 34,850 | |
| Total current assets | 612,013 | 630,645 | |
| Intangible assets, net | 19,389 | 28,769 | |
| Goodwill | 286,812 | 286,812 | |
| Property, plant and equipment, net | 73,374 | 67,808 | |
| Operating lease right-of-use assets | 21,039 | 21,497 | |
| Deferred tax assets | 129,348 | 127,892 | |
| Income taxes receivable | 104,270 | 88,768 | |
| Other assets | 5,325 | 6,036 | |
| Total assets | $1,251,570 | $1,258,227 | |
| LIABILITIES & STOCKHOLDERS’ EQUITY | |||
| Current liabilities: | |||
| Accounts payable | $20,365 | $18,074 | |
| Accrued salaries and benefits | 13,966 | 17,504 | |
| Deferred revenue | 18,404 | 17,393 | |
| Income taxes payable | 1,114 | 5,099 | |
| Operating lease liabilities | 5,397 | 4,453 | |
| Other current liabilities | 14,881 | 26,598 | |
| Total current liabilities | 74,127 | 89,121 | |
| Long-term liabilities: | |||
| Long-term operating lease liabilities | 24,794 | 26,255 | |
| Long-term income taxes payable | 101,350 | 78,947 | |
| Other long-term liabilities | 12,314 | 25,803 | |
| Total long-term liabilities | 138,458 | 131,005 | |
| Total stockholders’ equity | 1,038,985 | 1,038,101 | |
| Total liabilities and stockholders’ equity | $ 1,251,570 | $ 1,258,227 |
Rambus Inc.
Condensed Consolidated Statements of Operations
(Unaudited)
| Three Months Ended September 30, |
Nine Months Ended September 30, |
||||||
| (In thousands, except per share amounts) | 2024 | 2023 | 2024 | 2023 | |||
| Revenue: | |||||||
| Product revenue | $66,394 | $52,181 | $173,446 | $170,934 | |||
| Royalties | 64,105 | 28,857 | 167,961 | 97,698 | |||
| Contract and other revenue | 15,014 | 24,260 | 54,115 | 70,260 | |||
| Total revenue | 145,513 | 105,298 | 395,522 | 338,892 | |||
| Cost of revenue: | |||||||
| Cost of product revenue | 24,554 | 19,388 | 67,381 | 64,554 | |||
| Cost of contract and other revenue | 752 | 1,295 | 2,307 | 4,280 | |||
| Amortization of acquired intangible assets | 2,796 | 3,349 | 8,904 | 10,472 | |||
| Total cost of revenue | 28,102 | 24,032 | 78,592 | 79,306 | |||
| Gross profit | 117,411 | 81,266 | 316,930 | 259,586 | |||
| Operating expenses (benefits): | |||||||
| Research and development | 41,299 | 37,368 | 119,183 | 120,842 | |||
| Sales, general and administrative | 25,867 | 25,333 | 76,096 | 82,484 | |||
| Amortization of acquired intangible assets | 94 | 258 | 476 | 1,022 | |||
| Restructuring and other charges (recoveries) | — | (100) | — | 9,394 | |||
| Gain on divestiture | — | (90,843) | — | (90,843) | |||
| Impairment of assets | — | 10,045 | 1,071 | 10,045 | |||
| Change in fair value of earn-out liability | (4,544) | (5,666) | (5,044) | 8,134 | |||
| Total operating expenses (benefits) | 62,716 | (23,605) | 191,782 | 141,078 | |||
| Operating income | 54,695 | 104,871 | 125,148 | 118,508 | |||
| Interest income and other income (expense), net | 4,667 | 2,715 | 13,654 | 7,112 | |||
| Loss on fair value adjustment of derivatives, net | — | — | — | (240) | |||
| Interest expense | (327) | (356) | (1,064) | (1,113) | |||
| Interest and other income (expense), net | 4,340 | 2,359 | 12,590 | 5,759 | |||
| Income before income taxes | 59,035 | 107,230 | 137,738 | 124,267 | |||
| Provision for (benefit from) income taxes | 10,370 | 4,032 | 20,119 | (151,092) | |||
| Net income | $48,665 | $103,198 | $117,619 | $275,359 | |||
| Net income per share: | |||||||
| Basic | $0.45 | $0.95 | $1.09 | $2.54 | |||
| Diluted | $0.45 | $0.93 | $1.08 | $2.48 | |||
| Weighted average shares used in per share calculation | |||||||
| Basic | 107,235 | 108,317 | 107,681 | 108,412 | |||
| Diluted | 108,474 | 110,775 | 109,318 | 111,179 | |||
Rambus Inc.
Supplemental Reconciliation of GAAP to Non-GAAP Results
(Unaudited)
| Three Months Ended September 30, |
|||
| (In thousands) | 2024 | 2023 | |
| Cost of product revenue | $ 24,554 | $ 19,388 | |
| Adjustment: | |||
| Stock-based compensation expense | (117) | (149) | |
| Non-GAAP cost of product revenue | $ 24,437 | $ 19,239 | |
| Total operating expenses (benefits) | $ 62,716 | $(23,605) | |
| Adjustments: | |||
| Stock-based compensation expense | (11,881) | (9,889) | |
| Acquisition-related costs and retention bonus expense | (17) | (37) | |
| Amortization of acquired intangible assets | (94) | (258) | |
| Restructuring and other recoveries | — | 100 | |
| Expense on abandoned operating leases | — | (40) | |
| Facility restoration costs | — | 3 | |
| Severance costs | — | (373) | |
| Gain on divestiture | — | 90,843 | |
| Impairment of assets | — | (10,045) | |
| Change in fair value of earn-out liability | 4,544 | 5,666 | |
| Non-GAAP total operating expenses | $ 55,268 | $ 52,365 | |
| Interest and other income (expense), net | $4,340 | $2,359 | |
| Adjustment: | |||
| Interest income related to significant financing component from fixed-fee patent and technology licensing arrangements | (163) | (426) | |
| Non-GAAP interest and other income (expense), net | $4,177 | $1,933 | |
Rambus Inc.
Reconciliation of GAAP Forward-Looking Estimates to Non-GAAP Forward-Looking Estimates
(Unaudited)
| 2024 Fourth Quarter Outlook | Three Months Ended December 31, 2024 |
|||
| (In millions) | Low | High | ||
| Forward-looking operating costs and expenses | $101.0 | $ 97.0 | ||
| Adjustments: | ||||
| Stock-based compensation expense | (13.0) | (13.0) | ||
| Amortization of acquired intangible assets | (2.0) | (2.0) | ||
| Forward-looking Non-GAAP operating costs and expenses | $ 86.0 | $ 82.0 | ||
Root of Trust and Secure Authentication Solutions with Tamper-Resistant PUF Technology
Join experts from Rambus and PUF-based security solutions provider ICTK to learn how Rambus Root of Trust and Secure Authentication solutions combined with ICTK’s PUF technology can provide a highly robust hardware foundation to protect data, devices, and cloud. Our session will provide an overview of ICTK and its PUF technology, discuss the features and benefits of Root of Trust and Secure Authentication solutions, share potential use cases, and conclude with a Q&A session.
DDR5 RCD 8000 MT/s Product Brief
The Rambus Registering Clock Driver (RCD) RCD5 enables DDR5 Registered DIMMs (RDIMMs) operating up to 8000 MT/s.
Rambus Unveils Industry-First Complete Chipsets for Next-Generation DDR5 MRDIMMs and RDIMMs to Deliver Breakthrough Performance for Data Center and AI
Highlights:
- Introduces industry’s first Gen5 DDR5 RCD for RDIMMs at 8,000 MT/s, MRCD and MDB chips for next-generation MRDIMMs at 12,800 MT/s, and a second-generation server PMIC to support both
- Incorporates advanced clocking, control, and power management features needed for higher capacity and bandwidth modules operating at 8000 MT/s and above
- Feeds insatiable demand for higher memory performance in advanced data center and AI workloads
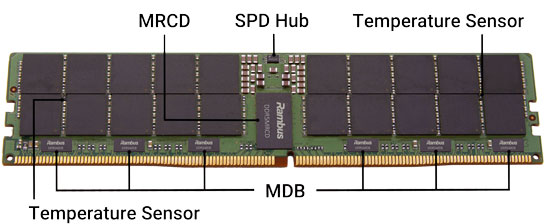
Figure 1: DDR5 MRDIMM 12800 (Front) Concept Image Showing Rambus MRCD, MDB, SPD Hub and Temperature Sensor ICs
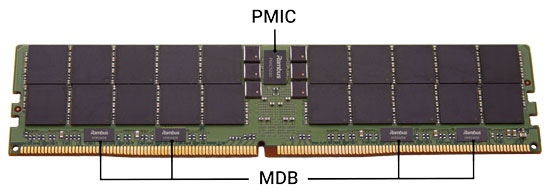
Figure 2: DDR5 MRDIMM 12800 (Back) Concept Image Showing Rambus PMIC5030 and MDB ICs
SAN JOSE, Calif. – Oct. 15, 2024 – Rambus Inc. (NASDAQ: RMBS), a premier chip and silicon IP provider making data faster and safer, today unveiled industry-first, complete memory interface chipsets for Gen5 DDR5 RDIMMs and next-generation DDR5 Multiplexed Rank Dual Inline Memory Modules (MRDIMMs). These innovative new products for RDIMMs and MRDIMMs will seamlessly extend DDR5 performance with unparalleled bandwidth and memory capacity for compute-intensive data center and AI workloads.
The new Rambus chips include:
- The Gen5 Registering Clock Driver (RCD), enabling RDIMMs operating at 8000 megatransfers per second (MT/s).
- The Multiplexed Registering Clock Driver (MRCD) and Multiplexed Data Buffer (MDB), enabling upcoming MRDIMMs running at speeds up to 12,800 MT/s by doubling the bandwidth of the DIMM beyond the native DRAM device speed.
- The second-generation server Power Management IC (PMIC5030) designed for both DDR5 RDIMM 8000 and MRDIMM 12800, providing ultra-high current at low voltage to support higher speeds and more DRAM and logic chips per module.
“The voracious memory demands of AI and HPC require the relentless pursuit of higher performance through continued innovation and technology leadership,” said Sean Fan, chief operating officer at Rambus. “With our 30-plus years of renowned high-speed signal integrity and memory system expertise, the Rambus Gen5 RCD, and next-generation MRCD, MDB, and PMIC will be critical enabling chips in future-generation servers leveraging DDR5 RDIMM 8000 and MRDIMM 12800.”
Enabling flexible and scalable end-user server configuration, the DDR5 RDIMM 8000 and industry-standard MRDIMM 12800 utilize a common architecture with compatibility across server platforms. The DDR5 RDIMM 8000 chipset includes the Gen5 RCD, PMIC5030, Serial Presence Detect (SPD) Hub and Temperature Sensor (TS) chips. The DDR5 MRDIMM 12800 chipset includes the MRCD and MDB, as well as the same PMIC5030, SPD Hub and TS chips utilized in the RDIMM 8000.
The DDR5 MRDIMM 12800 employs a novel and efficient module design that boosts data transfer rates and system performance by multiplexing two ranks of DRAM, effectively interleaving the two data streams. This allows the host memory bus to run at twice the data rate of the native DRAM devices, thus increasing bandwidth while using the same physical connections of DDR5 RDIMMs. This requires an MRCD that can address the two ranks of DRAMs on alternate clock cycles, as well as MDBs to direct the data stream to and from the correct DRAM devices. Each DDR5 MRDIMM 12800 requires one MRCD and ten MDB chips to multiplex the memory channel. The MRCD and MDB will also support a Tall MRDIMM form factor with four ranks of DDR5 DRAMs for double the capacity of a dual-rank RDIMM in a cost-effective manner.
The Gen5 RCD, MRCD, MDB and PMIC5030 are part of the growing Rambus portfolio of industry-leading memory interface and power management solutions including Gen1 to Gen4 RCD, Client Clock Driver (CKD), Server PMIC, SPD Hub, and TS chips.
More Information:
Learn more about the Rambus DDR5 memory interface and power management chips at https://www.rambus.com/ddr5.
Verifying the next generation High Bandwidth Memory controllers for AI and HPC applications
High Bandwidth Memory (HBM) has revolutionized AI, machine learning, and High-Performance Computing by significantly increasing data transfer speeds and alleviating performance bottlenecks. The introduction of next-generation HBM4 is especially transformative, enabling faster training and execution of complex AI models. JEDEC has announced that the HBM4 specification is nearing finalization. In this webinar, you will learn how Siemens’s scalable and customizable Avery HBM Verification IP helps companies like Rambus verify their industry-leading HBM4 Controller IP through rigorous testing to ensure reliability and performance.