The PLDA PCIe Switch for USB4 is a customizable, embedded switch for PCI Express (PCIe) designed for implementations in USB4 devices.
Rambus Completes Acquisition of PLDA
Extends CXL™ and PCI Express® Digital IP Leadership
SAN JOSE, Calif. – August 18, 2021 – Rambus Inc. (NASDAQ: RMBS), a provider of industry-leading chips and silicon IP making data faster and safer, today announced the completion of the acquisition of PLDA. With this acquisition, Rambus expands its digital controller offerings with complementary CXL 2.0, PCIe 5.0 and PCIe 6.0 controller and switch IP, and gains critical building blocks for its CXL Memory Interconnect Initiative.
“CXL and PCIe are critical enablers for next-generation data centers that will deliver the high-speed interconnects needed to tackle demanding workloads in AI/ML and HPC applications,” said Luc Seraphin, president and CEO of Rambus. “The addition of PLDA’s world-class digital IP and engineering expertise accelerates our roadmap and expands our market opportunity, and we are excited to welcome them to the team.”
Although this transaction will not materially impact 2021 financial results due to the timing of close and acquisition accounting, Rambus expects this acquisition to be accretive in 2022.
For more information, visit rambus.com/plda.
Forward-looking statements
Information set forth in this press release, including statements as to Rambus’ outlook and statements as to the expected timing, completion and effects of the acquisition, constitute forward-looking statements within the meaning of the safe harbor provisions of the Private Securities Litigation Reform Act of 1995.
These statements are based on various assumptions and the current expectations of the management of Rambus and may not be accurate because of risks and uncertainties surrounding these assumptions and expectations. Factors listed below, as well as other factors, may cause actual results to differ significantly from these forward-looking statements. There is no guarantee that any of the events anticipated by these forward-looking statements will occur, or what effect they will have on the operations or financial condition of Rambus. Forward-looking statements included herein are made as of the date hereof, and Rambus undertakes no obligation to publicly update or revise any forward-looking statement unless required to do so by federal securities laws.
Major risks, uncertainties and assumptions include, but are not limited to: the expected benefits and costs of the proposed transaction; management’s plans relating to the proposed transaction; the expected timing and completion of the proposed transaction; statements of the plans, strategies and objectives of Rambus for future operations; any statements regarding anticipated operational and financial results; any statements of expectation or belief; the risk that disruptions from the proposed transaction will harm Rambus’ business; other factors described under “Risk Factors” in Rambus’ Annual Report on Form 10-K and Quarterly Reports on Form 10-Q; and any statements of assumptions underlying any of the foregoing. It is not possible to predict or identify all such factors. Consequently, while the list of factors presented here is considered representative, no such list should be considered to be a complete statement of all potential risks and uncertainties.
CCIX 1.1 Controller with AXI Product Brief
The PLDA CCIX 1.1 Controller with AXI supports the PCI Express 5.0, 4.0 and 3.1/3.0 specifications, as well as with version 4.x and 5.x of the PHY Interface for PCI Express (PIPE) specification, and supports the CCIX Extended Speed Mode as defined in the CCIX Base Specification Revision 1.1.
Rambus Advances AI/ML Performance with 8.4 Gbps HBM3-Ready Memory Subsystem
Highlights:
- Provides HBM3-ready memory subsystem solution consisting of fully-integrated PHY and digital controller
- Supports data rates up to 8.4 Gigabits per second (Gbps), enabling terabyte-scale bandwidth accelerators for artificial intelligence/machine learning (AI/ML) and high-performance computing (HPC) applications
- Leverages market-leading HBM2/2E experience and installed-base to speed implementation of customer designs using next-generation HBM3 memory
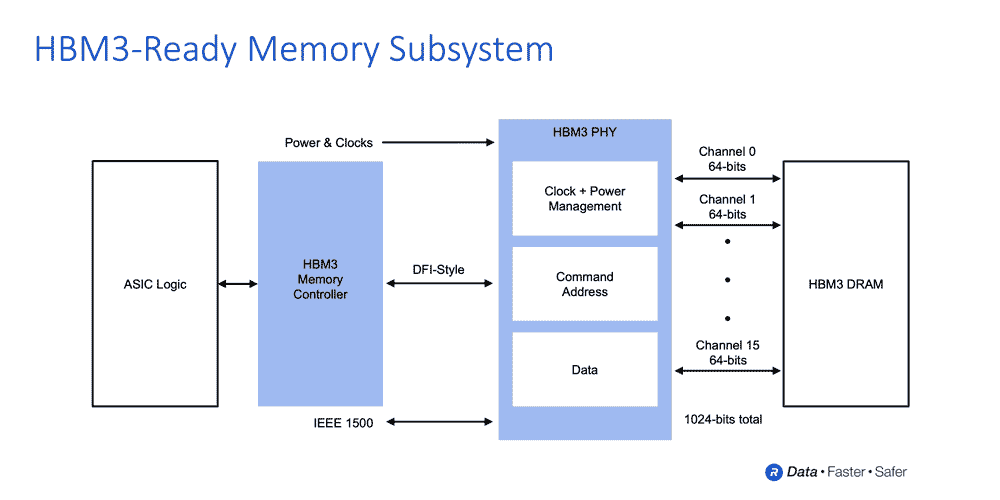
SAN JOSE, Calif. – Aug. 16, 2021 – Rambus Inc. (NASDAQ: RMBS), a premier chip and silicon IP provider making data faster and safer, today announced the Rambus HBM3-ready memory interface subsystem consisting of a fully-integrated PHY and digital controller. Supporting breakthrough data rates of up to 8.4 Gbps, the solution can deliver over a terabyte per second of bandwidth, more than double that of high-end HBM2E memory subsystems. With a market-leading position in HBM2/2E memory interface deployments, Rambus is ideally suited to enable customers’ implementations of accelerators using next-generation HBM3 memory.
“The memory bandwidth requirements of AI/ML training are insatiable with leading-edge training models now surpassing billions of parameters,” said Soo Kyoum Kim, associate vice president, Memory Semiconductors at IDC. “The Rambus HBM3-ready memory subsystem raises the bar for performance enabling state-of-the-art AI/ML and HPC applications.”
Rambus achieves HBM3 operation of up to 8.4 Gbps leveraging over 30 years of high-speed signaling expertise, and a strong history of 2.5D memory system architecture design and enablement. In addition to the fully-integrated HBM3-ready memory subsystem, Rambus provides its customers with interposer and package reference designs to speed their products to market.
“With the performance achieved by our HBM3-ready memory subsystem, designers can deliver the bandwidth needed by the most demanding designs,” said Matt Jones, general manager of Interface IP at Rambus. “Our fully-integrated PHY and digital controller solution builds on our broad installed base of HBM2 customer deployments and is backed by a full suite of support services to ensure first-time right implementations for mission-critical AI/ML designs.”
Benefits of the Rambus HBM3-ready Memory Interface Subsystem:
- Supports up to 8.4 Gbps data rate delivering bandwidth of 1.075 Terabytes per second (TB/s)
- Reduces ASIC design complexity and speeds time to market with fully-integrated PHY and digital controller
- Delivers full bandwidth performance across all data traffic scenarios
- Supports HBM3 RAS features
- Includes built-in hardware-level performance activity monitor
- Provides access to Rambus system and SI/PI experts helping ASIC designers to ensure maximum signal and power integrity for devices and systems
- Includes 2.5D package and interposer reference design as part of IP license
- Features LabStation™ development environment that enables quick system bring-up, characterization and debug
- Enables the highest performance in applications including state-of-the-art AI/ML training and high-performance computing (HPC) systems
For more information on the Rambus Interface IP, including our PHYs and Controllers, please visit rambus.com/interface-ip.
Rambus Reports Second Quarter 2021 Financial Results
- Exceeded Q2 guidance for revenue and profitability
- Generated $51.6 million in cash provided by operating activities
- Initiated $100 million accelerated share repurchase program
- Accelerated data center solution roadmap with CXL Memory Interconnect Initiative
- Announced the acquisitions of AnalogX and PLDA
SAN JOSE, Calif. – August 2, 2021 – Rambus Inc. (NASDAQ:RMBS), a provider of industry-leading chips and IP making data faster and safer, today reported financial results for the second quarter ended June 30, 2021. GAAP revenue for the second quarter was $84.9 million; licensing billings were $65.2 million, product revenue was $31.2 million, and contract and other revenue was $11.8 million. The Company also generated $51.6 million in cash provided by operating activities.
“Rambus had an exciting second quarter, making a number of strategic advancements to capture the next wave of semiconductor growth focused on next-generation data center architectures, and exceeding financial guidance for the top and bottom line,” said Luc Seraphin, chief executive officer of Rambus. “Product revenue from memory interface chips remains strong, and we had record revenue from security and digital controller IP. The Company continues to scale, putting us in a great position for long-term profitable growth.”
| Quarterly Financial Review – GAAP | Three Months Ended June 30, |
|||||||
| (In millions, except for percentages and per share amounts) | 2021 | 2020 | ||||||
| Revenue | ||||||||
| Product revenue | $31.2 | $31.7 | ||||||
| Royalties | 41.9 | 18.7 | ||||||
| Contract and other revenue | 11.8 | 11.3 | ||||||
| Total revenue | 84.9 | 61.7 | ||||||
| Cost of product revenue | 11.4 | 10.3 | ||||||
| Cost of contract and other revenue | 1.0 | 1.5 | ||||||
| Amortization of acquired intangible assets (included in total cost of revenue) | 4.5 | 4.3 | ||||||
| Total operating expenses (1) | 53.9 | 56.7 | ||||||
| Operating income (loss) | $14.1 | $(11.1) | ||||||
| Operating margin | 17% | (18)% | ||||||
| Net income (loss) | $11.2 | $(9.1) | ||||||
| Diluted net income (loss) per share | $0.10 | $(0.08) | ||||||
| Net cash provided by operating activities | $51.6 | $62.0 | ||||||
_________________________________________
(1) Includes amortization of acquired intangible assets of approximately $0.2 million for each of the three months ended June 30, 2021 and 2020.
| Quarterly Financial Review – Non-GAAP (including operational metric) (1) | Three Months Ended June 30, |
|||||||
| (In millions) | 2021 | 2020 | ||||||
| Licensing billings (2) | $65.2 | $60.7 | ||||||
| Product revenue | $31.2 | $31.7 | ||||||
| Contract and other revenue | $11.8 | $11.3 | ||||||
| Cost of product revenue | $11.4 | $10.3 | ||||||
| Cost of contract and other revenue | $1.0 | $1.5 | ||||||
| Total operating expenses | $43.7 | $47.7 | ||||||
| Interest and other income (expense), net | $(0.8) | $0.1 | ||||||
| Diluted share count | 115 | 115 | ||||||
_________________________________________
(1) See “Supplemental Reconciliation of GAAP to Non-GAAP Results” table included below. Note that the applicable non-GAAP measures are presented and that revenue and cost of contract and other revenue are solely presented on a GAAP basis.
(2) Licensing billings is an operational metric that reflects amounts invoiced to our licensing customers during the period, as adjusted for certain differences.
GAAP revenue for the quarter was $84.9 million, above the high end of the Company’s expectations. The Company also had licensing billings of $65.2 million, product revenue of $31.2 million, and contract and other revenue of $11.8 million. The Company had total GAAP cost of revenue of $16.9 million and operating expenses of $53.9 million. The Company also had total non-GAAP operating expenses of $56.1 million (which includes non-GAAP cost of revenue), below the low end of its expectations. The Company had GAAP diluted net income per share of $0.10. The Company’s diluted share count was 115 million shares. Due to the Company’s strong performance and focus on operational efficiency, the Company delivered excellent results in the second quarter, exceeding its revenue and profitability guidance.
Cash, cash equivalents, and marketable securities as of June 30, 2021 were $477.1 million, a decrease of $52.0 million from March 31, 2021, mainly due to $100 million paid in connection with an accelerated share repurchase program, partially offset by cash provided by operating activities of approximately $51.6 million.
2021 Third Quarter Outlook
The Company will discuss its full revenue guidance for the third quarter of 2021 during its upcoming conference call. The following table sets forth third quarter outlook for other measures.
| (In millions) | GAAP | Non-GAAP (1) | ||
| Licensing billings (2) | $59 – $65 | $59 – $65 | ||
| Product revenue | $34 – $40 | $34 – $40 | ||
| Contract and other revenue | $11 – $17 | $11 – $17 | ||
| Total operating costs and expenses | $76 – $72 | $65 – $61 | ||
| Interest and other income (expense), net | ($1) | ($1) | ||
| Diluted share count | 113 | 113 |
_________________________________________
(1) See “Reconciliation of GAAP Forward-Looking Estimates to Non-GAAP Forward-Looking Estimates” table included below. Note that the applicable non-GAAP measures are presented, and that revenue is solely presented on a GAAP basis.
(2) Licensing billings is an operational metric that reflects amounts invoiced to our licensing customers during the period, as adjusted for certain differences. This metric is the same for both GAAP and non-GAAP presentations.
For the third quarter of 2021, the Company expects licensing billings to be between $59 million and $65 million. The Company also expects royalty revenue to be between $25 million and $31 million, product revenue to be between $34 million and $40 million and contract and other revenue to be between $11 million and $17 million. Revenue is not without risk and achieving revenue in this range will require that the Company sign customer agreements for various product sales, solutions licensing among other matters.
The Company also expects operating costs and expenses to be between $76 million and $72 million. Additionally, the Company expects non-GAAP operating costs and expenses to be between $65 million and $61 million. These expectations also assume non-GAAP interest and other income (expense), net, of ($1 million), tax rate of 24% and diluted share count of 113 million, and exclude stock-based compensation expense ($8 million), amortization expense ($3 million), non-cash interest expense on convertible notes ($2 million) and interest income related to the significant financing component from fixed-fee patent and technology licensing arrangements ($2 million).
Conference Call
The Company’s management will discuss the results of the quarter during a conference call scheduled for 2:00 p.m. PT today. The call, audio and slides will be available online at investor.rambus.com and a replay will be available for the next week at the following numbers: (855) 859-2056 (domestic) or (404) 537-3406 (international) with ID# 7478989.
Non-GAAP Financial Information
In the commentary set forth above and in the financial statements included in this earnings release, the Company presents the following non-GAAP financial measures: operating expenses and interest and other income (expense), net. In computing each of these non-GAAP financial measures, the following items were considered as discussed below: stock-based compensation expense, acquisition-related costs and retention bonus expense, amortization of acquired intangible assets, expense on abandoned operating leases, facility restoration costs, non-cash interest expense and certain other one-time adjustments. The non-GAAP financial measures disclosed by the Company should not be considered a substitute for, or superior to, financial measures calculated in accordance with GAAP, and the financial results calculated in accordance with GAAP and reconciliations from these results should be carefully evaluated. Management believes the non-GAAP financial measures are appropriate for both its own assessment of, and to show investors, how the Company’s performance compares to other periods. The non-GAAP financial measures used by the Company may be calculated differently from, and therefore may not be comparable to, similarly titled measures used by other companies. Reconciliation from GAAP to non-GAAP results is included in the financial statements contained in this release.
The Company’s non-GAAP financial measures reflect adjustments based on the following items:
Stock-based compensation expense. These expenses primarily relate to employee stock options, employee stock purchase plans, and employee non-vested equity stock and non-vested stock units. The Company excludes stock-based compensation expense from its non-GAAP measures primarily because such expenses are non-cash expenses that the Company does not believe are reflective of ongoing operating results. Additionally, given the fact that other companies may grant different amounts and types of equity awards and may use different option valuation assumptions, excluding stock-based compensation expense permits more accurate comparisons of the Company’s results with peer companies.
Acquisition-related costs and retention bonus expense. These expenses include all direct costs of certain acquisitions and the current periods’ portion of any retention bonus expense associated with the acquisitions. The Company excludes these expenses in order to provide better comparability between periods as they are related to acquisitions and have no direct correlation to the Company’s operations.
Amortization of acquired intangible assets. The Company incurs expenses for the amortization of intangible assets acquired in acquisitions. The Company excludes these items because these expenses are not reflective of ongoing operating results in the period incurred. These amounts arise from the Company’s prior acquisitions and have no direct correlation to the operation of the Company’s core business.
Expense on abandoned operating leases. Reflects the expense on building leases that were abandoned. The Company excludes these charges because such charges are not directly related to ongoing business results and do not reflect expected future operating expenses.
Facility restoration costs. These charges consist of exit costs associated with our leased office space and are excluded because such charges are not directly related to ongoing business results and do not reflect expected future operating expenses.
Non-cash interest expense on convertible notes. The Company incurs non-cash interest expense related to its convertible notes. The Company excludes non-cash interest expense related to its convertible notes to provide more accurate comparisons of the Company’s results with other peer companies and to more accurately reflect the Company’s ongoing operations.
Income tax adjustments. For purposes of internal forecasting, planning and analyzing future periods that assume net income from operations, the Company estimates a fixed, long-term projected tax rate of approximately 24 percent for both 2021 and 2020, which consists of estimated U.S. federal and state tax rates, and excludes tax rates associated with certain items such as withholding tax, tax credits, deferred tax asset valuation allowance and the release of any deferred tax asset valuation allowance. Accordingly, the Company has applied these tax rates to its non-GAAP financial results for all periods in the relevant years to assist the Company’s planning.
On occasion in the future, there may be other items, such as significant gains or losses from contingencies that the Company may exclude in deriving its non-GAAP financial measures if it believes that doing so is consistent with the goal of providing useful information to investors and management.
About Rambus Inc.
Rambus is a provider of industry-leading chips and silicon IP making data faster and safer. With over 30 years of advanced semiconductor experience, we are a pioneer in high-performance memory subsystems that solve the bottleneck between memory and processing for data-intensive systems. Whether in the cloud, at the edge or in your hand, real-time and immersive applications depend on data throughput and integrity. Rambus products and innovations deliver the increased bandwidth, capacity and security required to meet the world’s data needs and drive ever-greater end-user experiences. For more information, visit rambus.com.
Forward-Looking Statements
This release contains forward-looking statements under the Private Securities Litigation Reform Act of 1995, including those relating to Rambus’ expectations regarding business opportunities, the Company’s ability to deliver long-term, profitable growth, and the Company’s outlook and financial guidance for the third quarter of 2021 and related drivers. Such forward-looking statements are based on current expectations, estimates and projections, management’s beliefs and certain assumptions made by the Company’s management. Actual results may differ materially. The Company’s business generally is subject to a number of risks which are described more fully in Rambus’ periodic reports filed with the Securities and Exchange Commission, as well as the potential adverse impacts related to, or arising from, the Novel Coronavirus (COVID-19). The Company undertakes no obligation to update forward-looking statements to reflect events or circumstances after the date hereof.
Contact
Rahul Mathur
Senior Vice President, Finance and Chief Financial Officer
Rambus Inc.
(408) 462-8000
[email protected]
Source: Rambus Inc.
Rambus Inc.
Condensed Consolidated Balance Sheets
(Unaudited)
| (In thousands) | June 30, 2021 |
December 31, 2020 |
||||||
| ASSETS | ||||||||
| Current assets: | ||||||||
| Cash and cash equivalents | $204,731 | $128,967 | ||||||
| Marketable securities | 272,382 | 373,682 | ||||||
| Accounts receivable | 38,730 | 27,903 | ||||||
| Unbilled receivables | 144,546 | 138,813 | ||||||
| Inventories | 8,052 | 14,466 | ||||||
| Prepaids and other current assets | 10,544 | 15,881 | ||||||
| Total current assets | 678,985 | 699,712 | ||||||
| Intangible assets, net | 27,203 | 36,487 | ||||||
| Goodwill | 183,222 | 183,222 | ||||||
| Property, plant and equipment, net | 50,058 | 57,693 | ||||||
| Operating lease right-of-use assets | 25,801 | 28,708 | ||||||
| Deferred tax assets | 3,907 | 4,353 | ||||||
| Unbilled receivables | 179,503 | 236,699 | ||||||
| Other assets | 4,306 | 4,535 | ||||||
| Total assets | $1,152,985 | $1,251,409 | ||||||
| LIABILITIES & STOCKHOLDERS’ EQUITY | ||||||||
| Current liabilities: | ||||||||
| Accounts payable | $8,975 | $8,993 | ||||||
| Accrued salaries and benefits | 15,878 | 23,326 | ||||||
| Deferred revenue | 12,299 | 10,198 | ||||||
| Income taxes payable | 19,754 | 20,064 | ||||||
| Operating lease liabilities | 6,722 | 4,724 | ||||||
| Other current liabilities | 17,798 | 18,559 | ||||||
| Total current liabilities | 81,426 | 85,864 | ||||||
| Long-term liabilities: | ||||||||
| Convertible notes | 159,806 | 156,031 | ||||||
| Long-term operating lease liabilities | 31,104 | 34,305 | ||||||
| Long-term income taxes payable | 31,853 | 41,333 | ||||||
| Deferred tax liabilities | 15,147 | 14,276 | ||||||
| Other long-term liabilities | 3,061 | 6,894 | ||||||
| Total long-term liabilities | 240,971 | 252,839 | ||||||
| Total stockholders’ equity | 830,588 | 912,706 | ||||||
| Total liabilities and stockholders’ equity | $1,152,985 | $1,251,409 | ||||||
Rambus Inc.
Condensed Consolidated Statements of Operations
(Unaudited)
| Three Months Ended June 30, |
Six Months Ended June 30, |
|||||||||||||||
| (In thousands, except per share amounts) | 2021 | 2020 | 2021 | 2020 | ||||||||||||
| Revenue: | ||||||||||||||||
| Product revenue | $31,170 | $31,725 | $61,951 | $62,453 | ||||||||||||
| Royalties | 41,910 | 18,744 | 70,769 | 40,226 | ||||||||||||
| Contract and other revenue | 11,779 | 11,248 | 22,521 | 24,815 | ||||||||||||
| Total revenue | 84,859 | 61,717 | 155,241 | 127,494 | ||||||||||||
| Cost of revenue: | ||||||||||||||||
| Cost of product revenue | 11,422 | 10,277 | 22,832 | 20,620 | ||||||||||||
| Cost of contract and other revenue | 1,017 | 1,535 | 2,573 | 2,733 | ||||||||||||
| Amortization of acquired intangible assets | 4,439 | 4,336 | 8,825 | 8,680 | ||||||||||||
| Total cost of revenue | 16,878 | 16,148 | 34,230 | 32,033 | ||||||||||||
| Gross profit | 67,981 | 45,569 | 121,011 | 95,461 | ||||||||||||
| Operating expenses: | ||||||||||||||||
| Research and development | 31,469 | 34,688 | 63,823 | 71,352 | ||||||||||||
| Sales, general and administrative | 22,184 | 21,721 | 45,746 | 45,027 | ||||||||||||
| Amortization of acquired intangible assets | 229 | 248 | 458 | 596 | ||||||||||||
| Restructuring charges | — | — | 368 | 836 | ||||||||||||
| Change in fair value of earn-out liability | — | — | — | (1,800) | ||||||||||||
| Total operating expenses | 53,882 | 56,657 | 110,395 | 116,011 | ||||||||||||
| Operating income (loss) | 14,099 | (11,088) | 10,616 | (20,550) | ||||||||||||
| Interest income and other income (expense), net | 2,381 | 4,688 | 5,362 | 11,131 | ||||||||||||
| Interest expense | (2,683) | (2,580) | (5,297) | (5,135) | ||||||||||||
| Interest and other income (expense), net | (302) | 2,108 | 65 | 5,996 | ||||||||||||
| Income (loss) before income taxes | 13,797 | (8,980) | 10,681 | (14,554) | ||||||||||||
| Provision for income taxes | 2,631 | 160 | 2,128 | 1,125 | ||||||||||||
| Net income (loss) | $11,166 | $(9,140) | $8,553 | $(15,679) | ||||||||||||
| Net income (loss) per share: | ||||||||||||||||
| Basic | $0.10 | $(0.08) | $0.08 | $(0.14) | ||||||||||||
| Diluted | $0.10 | $(0.08) | $0.07 | $(0.14) | ||||||||||||
| Weighted average shares used in per share calculation | ||||||||||||||||
| Basic | 112,144 | 113,572 | 112,177 | 113,240 | ||||||||||||
| Diluted | 114,931 | 113,572 | 115,358 | 113,240 | ||||||||||||
Rambus Inc.
Supplemental Reconciliation of GAAP to Non-GAAP Results
(Unaudited)
| Three Months Ended June 30, |
||||||||
| (In thousands) | 2021 | 2020 | ||||||
| Cost of product revenue | $11,422 | $10,277 | ||||||
| Adjustment: | ||||||||
| Stock-based compensation expense | (70) | — | ||||||
| Non-GAAP cost of product revenue | $11,352 | $10,277 | ||||||
| Total operating expenses | $53,882 | $56,657 | ||||||
| Adjustments: | ||||||||
| Stock-based compensation expense | (7,228) | (6,707) | ||||||
| Acquisition-related costs and retention bonus expense | (2,200) | (1,577) | ||||||
| Amortization of acquired intangible assets | (229) | (248) | ||||||
| Expense on abandoned operating leases | (521) | — | ||||||
| Facility restoration costs | — | (411) | ||||||
| Non-GAAP total operating expenses | $43,704 | $47,714 | ||||||
| Interest and other income (expense), net | $(302) | $2,108 | ||||||
| Adjustments: | ||||||||
| Interest income related to significant financing component from fixed-fee patent and technology licensing arrangements | (2,382) | (3,788) | ||||||
| Non-cash interest expense on convertible notes | 1,901 | 1,798 | ||||||
| Non-GAAP interest and other income (expense), net | $(783) | $118 | ||||||
Rambus Inc.
Reconciliation of GAAP Forward-Looking Estimates to Non-GAAP Forward-Looking Estimates
(Unaudited)
| 2021 Third Quarter Outlook | Three Months Ended September 30, 2021 |
|||||||
| (In millions) | Low | High | ||||||
| Forward-looking operating costs and expenses | $76.2 | $72.2 | ||||||
| Adjustments: | ||||||||
| Stock-based compensation expense | (8.0) | (8.0) | ||||||
| Amortization of acquired intangible assets | (3.2) | (3.2) | ||||||
| Forward-looking Non-GAAP operating costs and expenses | $65.0 | $61.0 | ||||||
| Forward-looking interest and other income (expense), net | $(0.8) | $(0.8) | ||||||
| Adjustments: | ||||||||
| Interest income related to significant financing component from fixed-fee patent and technology licensing arrangements | (2.1) | (2.1) | ||||||
| Non-cash interest expense on convertible notes | 1.9 | 1.9 | ||||||
| Forward-looking Non-GAAP interest and other income (expense), net | $(1.0) | $(1.0) | ||||||
Rambus Completes Acquisition of AnalogX
Expands PCIe® 5.0 and 32G Multi-protocol SerDes with ultra-low power interface IP
SAN JOSE, Calif. – July 6, 2021 – Rambus Inc. (NASDAQ: RMBS), a provider of industry-leading chips and silicon IP making data faster and safer, today announced the completion of the acquisition of AnalogX. With this acquisition, Rambus augments its family of PCIe 5.0 and 32G Multi-protocol PHYs with SerDes technology specifically built for ultra-low power and very low latency. In addition, AnalogX interface IP enhances the Rambus roadmap for PAM4-based PCIe 6.0 and CXL™ 3.0 solutions and provides key building blocks for the CXL Memory Initiative.
“We are excited to welcome the AnalogX team to the Rambus family,” said Luc Seraphin, president and CEO of Rambus. “Their technology and expertise are an ideal fit for Rambus and accelerate our roadmap for next-generation data center interconnect solutions.”
Although this transaction will not materially impact 2021 financial results due to the timing of close and acquisition accounting, Rambus expects this acquisition to be accretive in 2022.
For more information, visit rambus.com/analogx.
Forward-looking statements
Information set forth in this press release, including statements related to the expected opportunity, terms, timing, completion and effects of the acquisition of AnalogX, constitute forward-looking statements within the meaning of the safe harbor provisions of the Private Securities Litigation Reform Act of 1995.
These statements are based on various assumptions and the current expectations of the management of Rambus and may not be accurate because of risks and uncertainties surrounding these assumptions and expectations. Factors listed below, as well as other factors, may cause actual results to differ significantly from these forward-looking statements. There is no guarantee that any of the events anticipated by these forward-looking statements will occur, or what effect they will have on the operations or financial condition of Rambus. Forward-looking statements included herein are made as of the date hereof, and Rambus undertakes no obligation to publicly update or revise any forward-looking statement unless required by law to do so.
Major risks, uncertainties and assumptions include, but are not limited to: market trends and drivers; unexpected costs and limitations associated with the proposed transaction; challenges to management’s plans, strategies and objectives, including related to the proposed transaction; changes to the expected timing, terms or completion of the proposed transaction; operational and financial results, including the expectation that the acquisition of AnalogX will be accretive to Rambus in 2022; disruptions to or from the proposed transaction or other harm to Rambus’ business; and other factors, such as those described under “Risk Factors” in Rambus’ Annual Report on Form 10-K and Quarterly Reports on Form 10-Q. It is not possible to predict or identify all such factors. Consequently, while the list of factors presented here is considered representative, no such list should be considered to be a complete statement of all potential risks and uncertainties.