- Launches research and development effort to drive architectural shift in data centers with solutions for memory expansion and pooling that enable disaggregated and composable server architectures
- Combines unique expertise in high-speed interfaces, embedded security and server memory buffers to develop breakthrough solutions for next-generation data centers
- Leverages critical building blocks to be provided by PLDA and AnalogX acquisitions, accelerating CXL roadmap and market leadership
SAN JOSE, Calif. – June 16, 2021 – Rambus Inc. (NASDAQ: RMBS), a provider of industry-leading chips and silicon IP making data faster and safer, today announced the CXL Memory Interconnect Initiative to define and develop semiconductor solutions for advanced data center architectures that maximize performance, improve efficiency and reduce system cost. To support the continuing growth and specialization in server workloads, data center is moving to disaggregated architectures composed from shared and scalable pools of computing and memory resources. Compute Express Link™ (CXL) is a critical enabler of these next-generation disaggregated server architectures. As part of this initiative, Rambus is focusing its initial research and development on semiconductor solutions to support key memory expansion and pooling use cases. The acquisitions of PLDA and AnalogX provide key products and expertise that complement the company’s leadership in server memory interface chips and further accelerate the roadmap for innovative CXL interconnect solutions for next-generation data centers.
“Modern server architectures are taking a revolutionary step forward to support the growing demands of advanced workloads like AI/ML,” said Luc Seraphin, president and CEO of Rambus. “This initiative is highly complementary to our existing server DIMM chipset business and brings together our unique combination of semiconductor and system expertise to develop breakthrough interconnect solutions that improve performance, security, efficiency and TCO for future data centers.”
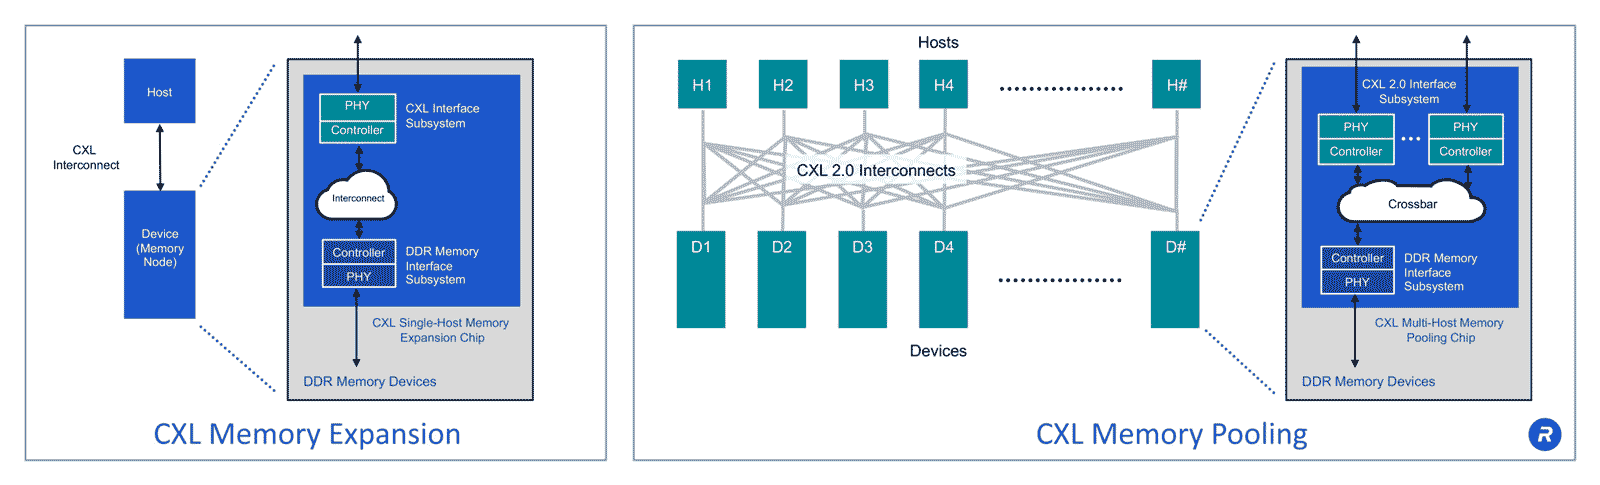
CXL is an open industry standard interconnect delivering high-bandwidth, low-latency connectivity between dedicated compute, memory, I/O and storage elements within the data center to allow the provision of the optimal mix of each for a given workload. CXL memory expansion and pooling chips are key components for both traditional and disaggregated architectures. Rambus is uniquely positioned to deliver these solutions as a leading provider of the diverse set of required building blocks including:
- CXL and PCIe® PHYs and controllers to interface with host processors and other devices
- DDR memory PHYs and controllers to interface with memory devices
- Advanced cryptographic cores and secure protocol engines to enable secure firmware downloads and protect the links against data tampering and physical attacks with Integrity and Data Encryption (IDE) security
In addition, Rambus has extensive experience delivering memory interface chips at high volume to the server ecosystem and critical system-level expertise to speed time to market. Rambus is engaging with the full ecosystem including cloud, system and memory companies, to accelerate the development and enablement of CXL memory interconnect solutions.
For more information, visit rambus.com/cxlmemoryinterconnects