When Jann Horn of Google’s Project Zero posted a detailed blog titled “Reading privileged memory with a side-channel,” it set off a firestorm of activity as the post confirmed that secret information inside a computer could be accessed via two different attacks, Meltdown and Spectre. Essentially, both attacks utilize CPU data cache timing to efficiently exploit and leak information from the system. This could lead to – at worst – arbitrary virtual memory read vulnerabilities across local security boundaries in various contexts.
Secure Silicon IP Series: Will the Real Root of Trust Please Stand Up? (Part Two)
In simple terms, a root of trust is the security foundation for a system-on-a-chip (SoC) or electronic system. Any functionality that needs to be secure relies in whole or in part on that root of trust. However, the term “root of trust” means different things to different people. In some cases, a root of trust is thought to be a single key that was either provisioned to a device or generated by the device itself. In other cases, a root of trust is seen as code, usually boot code, that is immutable and considered always trusted. A newer definition of a root of trust is a hardware module embedded in a chip or system that provides security functionality that keeps the entire chip or system secure.
Rambus Expands Family of CryptoManager Root of Trust Secure Silicon IP Cores
Highlights:
- Offers tailored configurations addressing the security needs of Internet of things (IoT), artificial intelligence (AI), machine learning (ML), cloud, government, military and automotive applications
- Employs fully programmable hardware-level security co-processor with the ability to adapt to a dynamic threat environment
- Purpose-built, complete security solution offers ease of integration into SoC designs
- Features FIPS 140-2 ready crypto module and accelerators and DPA resistant crypto cores; designed for automotive-specific configuration ISO-26262-2018 ASIL-D
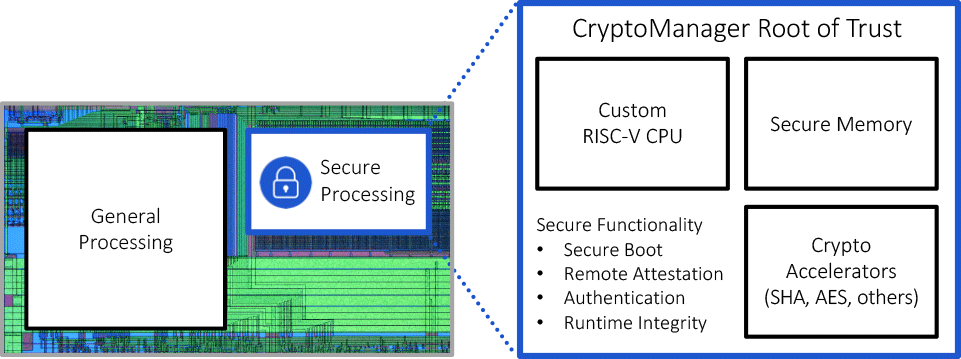
SUNNYVALE, Calif. – June 26, 2019 – Rambus Inc. (NASDAQ: RMBS) today announced the expansion of the CryptoManager Root of Trust family of products, a series of fully programmable, hardware-level secure silicon IP cores to address the security needs of applications including IoT, AI, ML, cloud, government, military and automotive. CryptoManager cores employ a siloed architecture. They isolate and secure sensitive code, processes, and algorithms from the main processor cores. This mitigates the risk of critical vulnerabilities like the Meltdown and Spectre security flaws. The CryptoManager Root of Trust is purpose-built for security — it features tailored configurations that allow chip designers to optimize main processors for high performance, while relying on the root of trust to perform security processes.
“Security is a mission critical imperative for SoC designs serving virtually every application space,” said Neeraj Paliwal, vice president of products, cryptography at Rambus. “The Rambus CryptoManager Root of Trust family offers tailored secure silicon IP solutions which chip architects can incorporate to meet the specific security needs of their designs.”
Offering a full array of security services, the CryptoManager Root of Trust enables secure boot and runtime integrity checking, remote authentication and attestation, and hardware acceleration for symmetric and asymmetric cryptographic algorithms. Featuring a layered security model, Federal Information Processing Standards (FIPS) 140-2 certified crypto accelerators, and multiple roots of trust to support independent privilege levels, the CryptoManager Root of Trust serves a wide range of applications.
The CryptoManager Root of Trust creates a foundation for Rambus’ comprehensive CryptoManager suite of solutions, including the CryptoManager Infrastructure for secure provisioning. For more information on the Rambus CryptoManager Root of Trust family of cores, visit rambus.com/security/cryptomanager-platform/root-of-trust/.
CryptoManager Root of Trust Technical Details
Within the product family, seven standard configurations address the specific security requirements and certification standards of different end markets. The RT-730 automotive design offers an ISO-26262-2018 ASIL-D-ready implementation, targeting vehicle-to-vehicle and vehicle-to-infrastructure (V2X), advanced driver-assistance systems (ADAS), and infotainment uses. For cloud, AI and ML accelerator chips, the RT-630 helps secure valuable training models, and training and inference data. For government-focused chip designs, the RT-650 offers a design that targets FIPS 140-2 Cryptographic Module Validation Program (CMVP) certification with Suite B accelerators. The RT-660 extends the functionality of RT-650 with the addition of Differential Power Analysis resistant cryptographic cores.
The CryptoManager Root of Trust family of products offers an end-to-end security implementation, comprised of a fully synthesizable IP core that anchors trust in silicon. It includes state-of-the-art crypto accelerators, security firewalls, an entropy source, secure key generation and derivation, secure one-time programmable (OTP) memory management, and a complete secure embedded firmware stack. The secure firmware stack offers secure boot for the root of trust as well as the SoC CPU(s), communicating securely with the SoC stack and running signed secure applications on the root of trust’s CPU. A reference SDK allows integrators to build secure boot, secure firmware updates and secure applications, with provided examples and references. Available evaluation boards and QEMU allow chip designers to easily evaluate the CryptoManager Root of Trust and secure applications.
Secure Silicon IP Series: Complexity vs. Security (Part One)
This webinar will explore some of the threats facing SoC and processor designers and how can SoCs be architected for both performance and security.
Achronix Chooses Rambus GDDR6 PHY IP for Next-Generation FPGA
Delivering best-in-class solutions for artificial intelligence and hardware acceleration applications
SUNNYVALE, Calif – June 4, 2019 – Rambus Inc. (NASDAQ: RMBS) today announced that Achronix, a leader in FPGA-based hardware data acceleration devices and high-performance eFGPA IP, has selected the Rambus GDDR6 PHY for its next-generation Speedster7t FPGA family. Leveraging the top-end data rates delivered by the Rambus GDDR6 memory interface, the Speedster7t family is optimized for artificial intelligence (AI), machine learning (ML) and high-bandwidth data acceleration applications and workloads.
Designed for performance and power efficiency, the Rambus GDDR6 PHY is beneficial for advanced driver-assistance systems (ADAS), AI, ML, graphics and networking applications. Rambus’ GDDR6 PHY enables the communication to and from high-speed, high-bandwidth GDDR6 SDRAM memory, which is a high-performance memory solution that can be used in a variety of applications that require large amounts of data computation.
“GDDR6 is emerging as a mainstream memory solution for high-performance AI/ML and networking applications, and, in utilizing Rambus’ GDDR6 PHY IP, Achronix is an early leader in adopting the technology to differentiate its next generation of products,” said Hemant Dhulla, vice president and general manager of IP Cores at Rambus. “We are excited to be working with Achronix to expand its portfolio of high-performance FPGA solutions, including its latest Speedster 7t family.”
“New use cases for GDDR6 such as AI/ML require extremely fast data transfer between memory and compute,” said Steve Mensor, vice president of marketing, Achronix. “Rambus’ GDDR6 PHY IP will enable Achronix’ Speedster7t FPGA family to support these high-performance data acceleration applications at a low cost with low latency, allowing it to process complex data loads quickly and efficiently.”
For more information on our latest Rambus GDDR6 high speed memory offerings, please visit www.rambus.com/gddr6. Or, visit Achronix in Booth 861 at the Design Automation Conference (DAC) in Las Vegas, NV from June 2 – 6, 2019 to learn more.
Rambus and Infineon Team Up to Bring Global Smart Card and Mobile Ticketing Offerings to Transport
End-to-end CIPURSE solution to extend worldwide reach, providing flexibility, innovation and security key to future mobility services
SUNNYVALE, Calif. and Glasgow, UK – May 29, 2019 – Rambus Inc. (NASDAQ: RMBS), a technology leader in smart ticketing solutions for public transport, today announced a new strategic collaboration with Infineon Technologies AG, a global leader in semiconductor solutions, to jointly promote smart ticketing solutions for mobile and smart cards that will drive the next generation of mobility services worldwide. Both companies will combine their expertise on the CIPURSE™ open standard for mobile and smart card ticketing to provide end users the most comprehensive choice of solutions for future proof transport ticketing solutions.
CIPURSE™ is an open standard supported by a global community of members of the OSPT Alliance. As key supporters and board members of the OSPT Alliance, Rambus and Infineon recognise the trust and integrity CIPURSE™ provides as a platform upon which to build a flexible and secure interoperable ticketing proposition.
With extensive experience implementing scalable smart mobile ticketing solutions, Rambus will bring its Host Card Emulation (HCE) Ticket Wallet Service and Remote Ticket Download (RTD) solutions to the collaboration, providing secure download and storage of tickets on NFC-enabled smartphones and the ability to deliver tickets remotely to smartcards. Along with Infineon’s CIPURSE™ smart ticketing products, the companies will both be able to better deliver a high level of security for the international smart ticketing market, with mobile and smart card ticketing working in tandem.
Russell McCullagh, vice president and general manager of Rambus Ticketing commented: “Through our collaboration with Infineon, we will be able to increase global trust and awareness of the benefits of this open standards-based approach, which can help make public transport ticketing more accessible for all transport scenarios, whether passengers are on rail, bus or ferry.”
Bernardo Knoblich, head of Transport Ticketing Product Line of Infineon Technologies said: “Our expanded collaboration with Rambus is underlining Infineon’s commitment to open standards-based solutions. Innovative services where smart card-based ticketing is deployed along with mobile solutions on a global scale will improve user convenience and hence drive adoption of new mobility services.”
For more information on the Rambus Smart Ticketing solutions, visit rambus.com/smart-ticketing.